Hi Script gurus
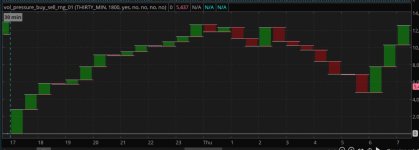
I am looking at these volume pressure histogram bars (https://usethinkscript.com/threads/...ssure-indicators-labels-for-thinkorswim.8466/) and wanted to see the histogram charts in different way like a trend chart. Can you please help to write the script. Here is the logic I am thinking.
Lets take 5 min candle chart. The time / count always starts at 6 PM (EST) and resets next day at 6 PM (EST).
1. At 6 PM, there was 0 volume
2. Between 6.00 - 6.05 PM, there was 100 BUY volume, so the chart goes +100 Up
3. Between 6.05 - 6.10 PM, there was another 100 BUY volume, so the next candle starts at 101 and goes all the way up until 200
4. Between 6.10 - 6. 12 PM, there was another 50 BUY volume, so the next candle starts at 201 and goes all the way up until 250
4a. Between 6.12 - 6.14 PM, there was 100 SELL volume, so the candle goes down from 250 to 150.
4b. Between 6.14 - 6.15 PM, there ws 150 BUY volume, so that candle goes up from 150 to 300. While creating a wick between 150 - 200
5. Between 6.15 - 6.17 PM, there was 300 BUY volume, so the next candle starts at 301 and goes all the way up to 600
5a. Between 6.17 - 6.20 PM, there was 400 SELL volume, so the candle moves down from 600 - 200. While creating a wick between 600 - 301
6. Between 6.20 PM - 6.25 PM, there was 400 SELL volume, so the candle starts at 199 and goes all the way down till -200
7. Between 6.25 - 6.27 PM, there was 50 BUY volume, so the candle starts at -199 and goes up to -150.
7a. Betwen 6.27 PM - 6.30 PM, there was 350 SELL volume, so the candle goes down till -500. While creating a wick from -150 - -200
and so on. This logic ccan be used in all time frame. Hope I am explaining clearly. Thanks for your help