
Author states:
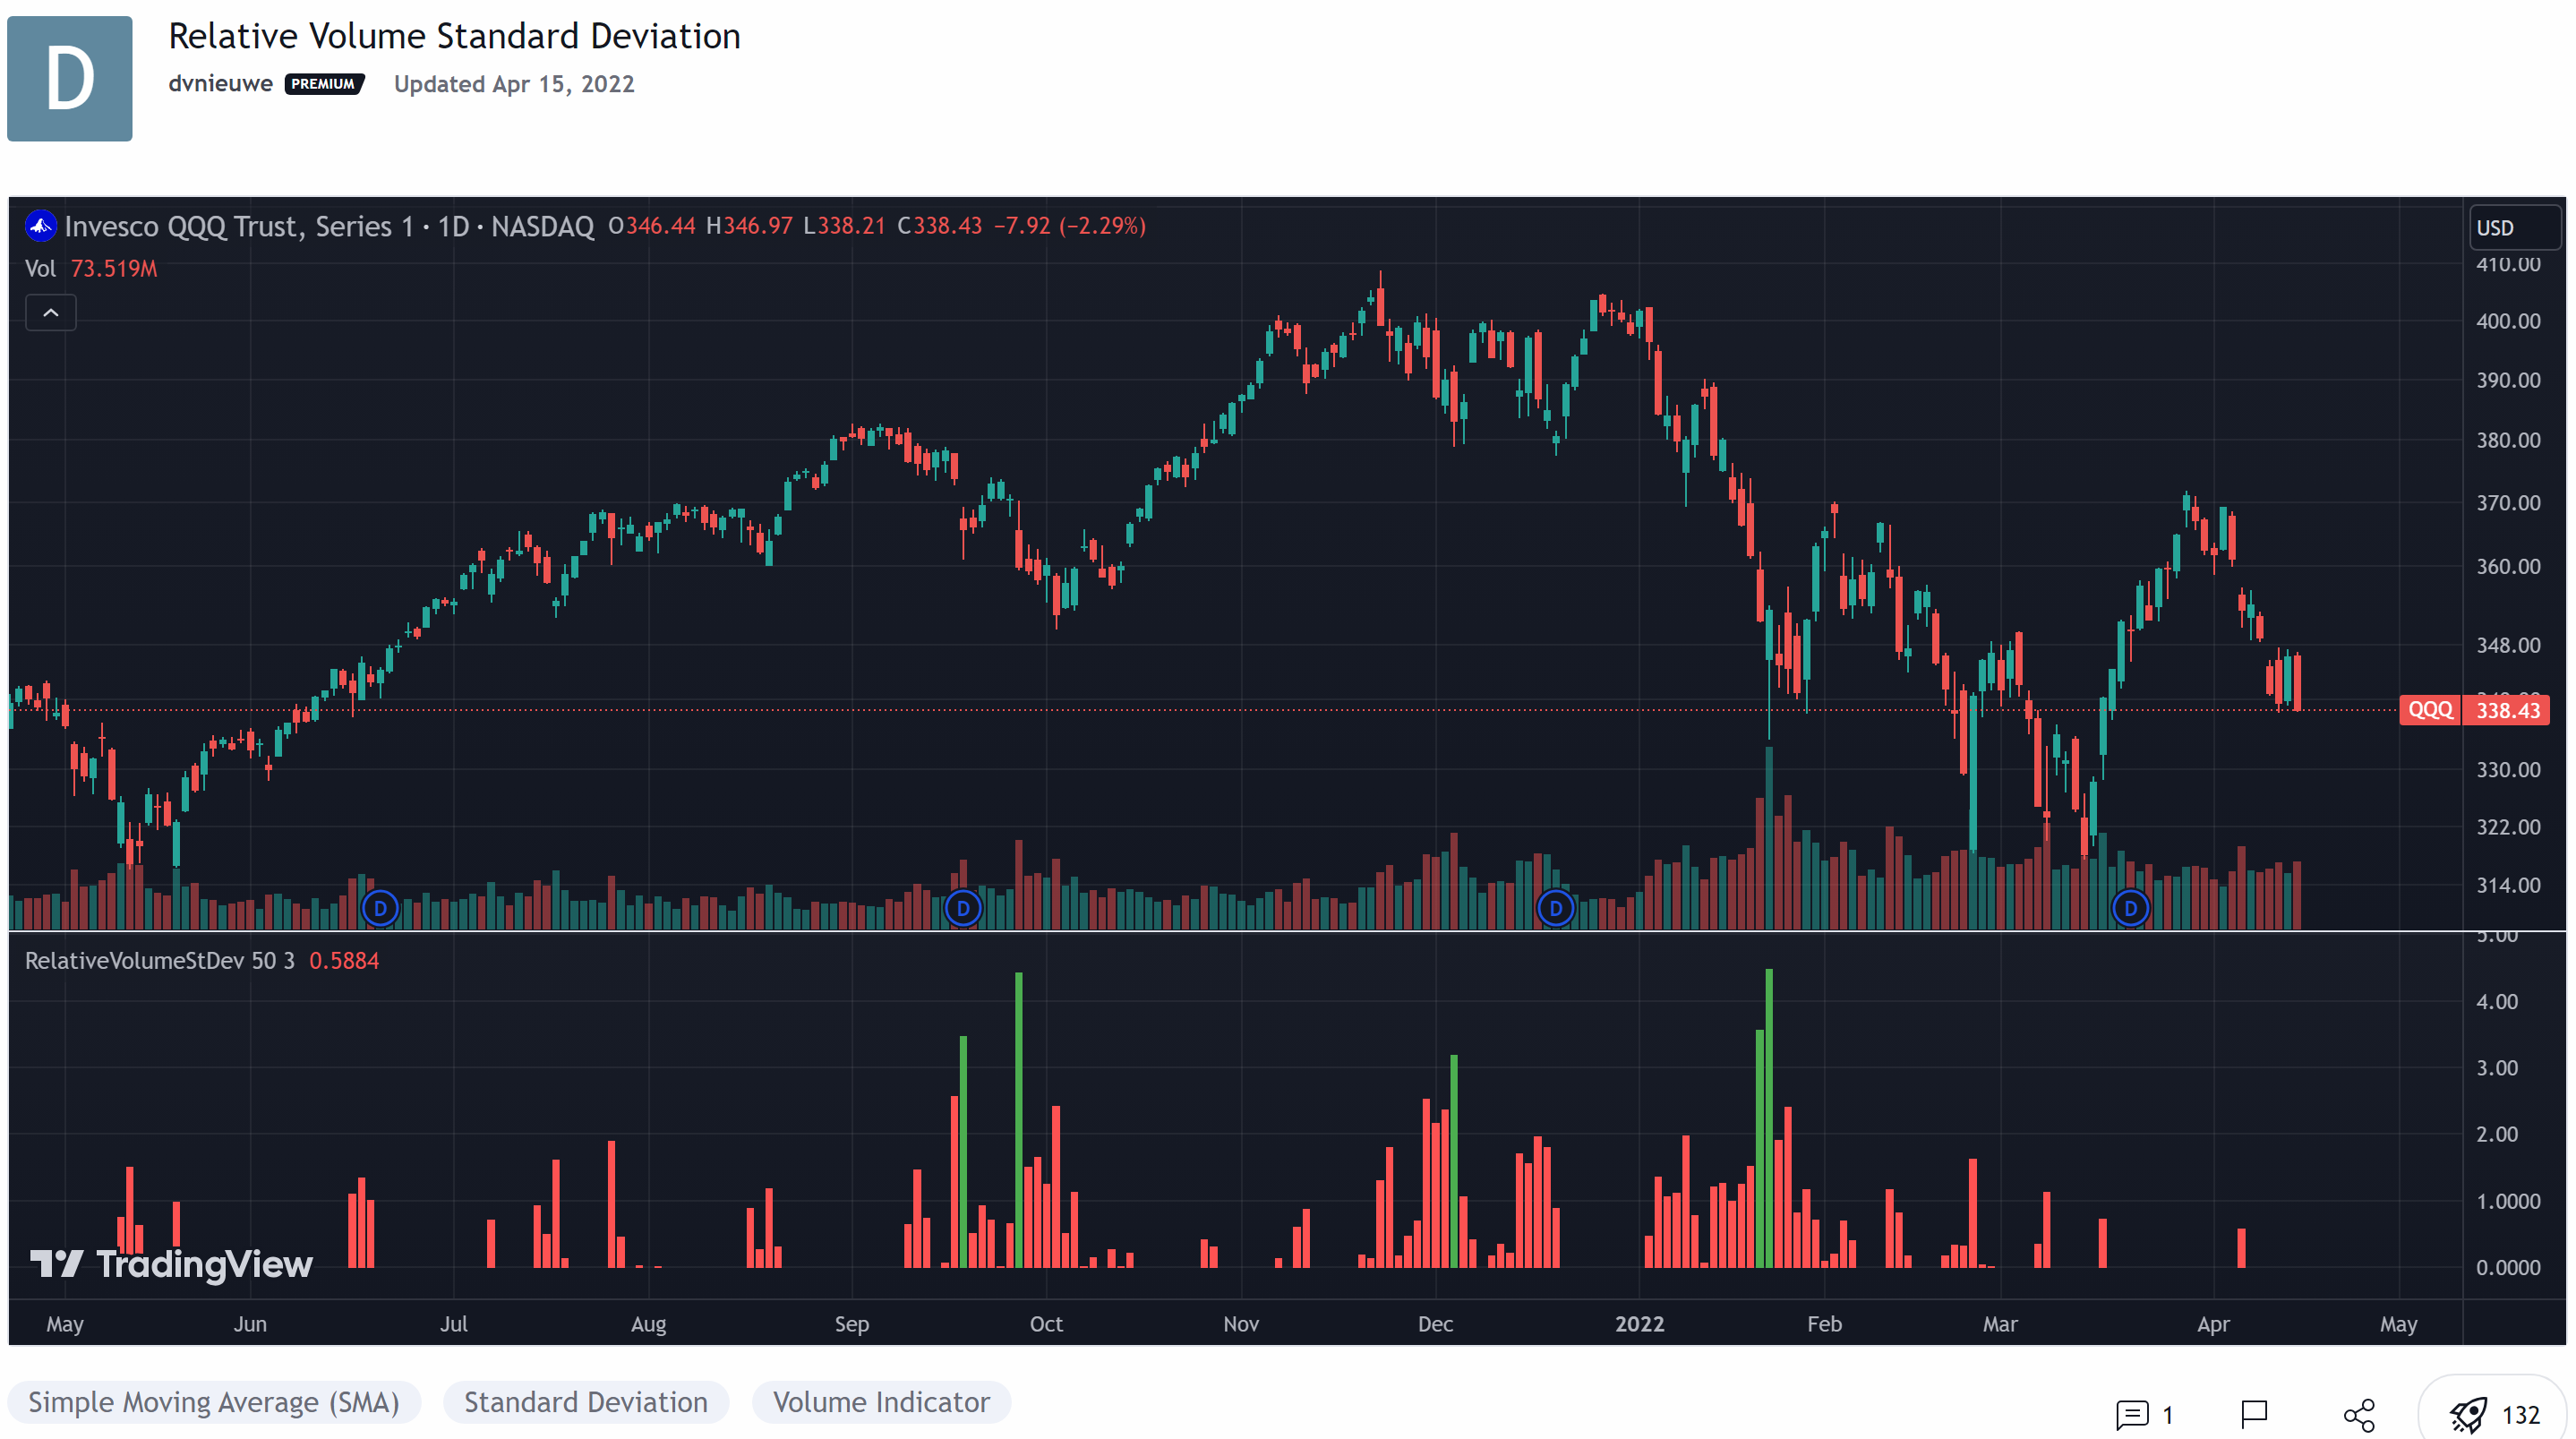
This indicator, developed by Melvin E. Dickover, calculates the difference between the volume and its simple moving average, but expressed as a ratio in standard deviations.
The plotted bars become green when the volume is unusually large (configurable).
Hello All,
I need help converting from tradingview to TOS study. Below is the tradingview url and source code. Thanks and have a good weekend.
https://www.tradingview.com/script/Eize4T9L-Relative-Volume-Standard-Deviation/
Last edited by a moderator: