# Multiple symbol EMA status and relative strength analysis
# Created by @tony_futures
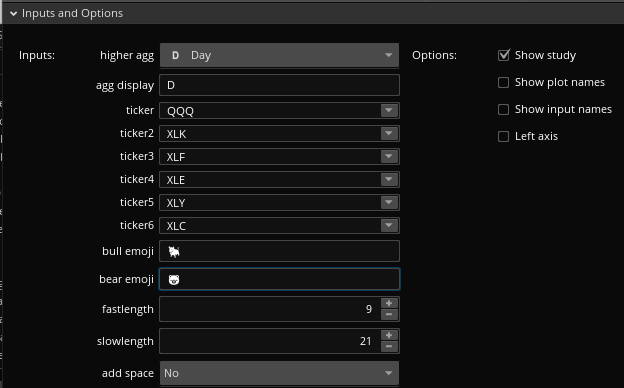
input higherAgg = AggregationPeriod.DAY;
input aggDisplay = "Daily";
input ticker = "QQQ";
input ticker2 = "XLK";
input ticker3 = "XLF";
input ticker4 = "XLE";
input ticker5 = "XLY";
input ticker6 = "XLC";
input bullEmoji = "";
input bearEmoji = "";
input fastlength = 9;
input slowlength = 21;
DefineGlobalColor("green", CreateColor(94, 110, 59));
DefineGlobalColor("red", CreateColor(136, 93, 100));
DefineGlobalColor("darkgreen", Color.DARK_GREEN);
DefineGlobalColor("darkred", Color.DARK_RED);
# Daily Avg
def dailyPrice = close(symbol = ticker, period=higherAgg);
def DailyFastAvg = ExpAverage(dailyPrice, fastlength);
def DailySlowAvg = ExpAverage(dailyPrice, slowlength);
def dailyPrice2 = close(symbol = ticker2, period=higherAgg);
def DailyFastAvg2 = ExpAverage(dailyPrice2, fastlength);
def DailySlowAvg2 = ExpAverage(dailyPrice2, slowlength);
def dailyPrice3 = close(symbol = ticker3, period=higherAgg);
def DailyFastAvg3 = ExpAverage(dailyPrice3, fastlength);
def DailySlowAvg3 = ExpAverage(dailyPrice3, slowlength);
def dailyPrice4 = close(symbol = ticker4, period=higherAgg);
def DailyFastAvg4 = ExpAverage(dailyPrice4, fastlength);
def DailySlowAvg4 = ExpAverage(dailyPrice4, slowlength);
def dailyPrice5 = close(symbol = ticker5, period=higherAgg);
def DailyFastAvg5 = ExpAverage(dailyPrice5, fastlength);
def DailySlowAvg5 = ExpAverage(dailyPrice5, slowlength);
def dailyPrice6 = close(symbol = ticker6, period=higherAgg);
def DailyFastAvg6 = ExpAverage(dailyPrice6, fastlength);
def DailySlowAvg6 = ExpAverage(dailyPrice6, slowlength);
# Relative Strength
def RS = if dailyPrice == 0 then 0 else close(period=higherAgg)/dailyPrice;
def sr = CompoundValue("historical data" = RS, "visible data" = if isNaN(sr[1]) then RS else sr[1]);
def strong = RS > SR;
def weak = RS < SR;
def RS1 = if dailyPrice2 == 0 then 0 else close(period=higherAgg)/dailyPrice2;
def sr1 = CompoundValue("historical data" = RS1, "visible data" = if isNaN(sr1[1]) then RS1 else sr1[1]);
def strong1 = RS1 > SR1;
def weak1 = RS1 < SR1;
def RS2 = if dailyPrice3 == 0 then 0 else close(period=higherAgg)/dailyPrice3;
def sr2 = CompoundValue("historical data" = RS2, "visible data" = if isNaN(sr2[1]) then RS2 else sr2[1]);
def strong2 = RS2 > SR2;
def weak2 = RS2 < SR2;
def RS3 = if dailyPrice4 == 0 then 0 else close(period=higherAgg)/dailyPrice4;
def SR3 = CompoundValue("historical data" = RS3, "visible data" = if isNaN(SR3[1]) then RS3 else SR3[1]);
def strong3 = RS3 > SR3;
def weak3 = RS3 < SR3;
def RS4 = if dailyPrice5 == 0 then 0 else close(period=higherAgg)/dailyPrice5;
def SR4 = CompoundValue("historical data" = RS4, "visible data" = if isNaN(SR4[1]) then RS4 else SR4[1]);
def strong4 = RS4 > SR4;
def weak4 = RS4 < SR4;
def RS5 = if dailyPrice6 == 0 then 0 else close(period=higherAgg)/dailyPrice6;
def SR5 = CompoundValue("historical data" = RS5, "visible data" = if isNaN(SR5[1]) then RS5 else SR5[1]);
def strong5 = RS5 > SR5;
def weak5 = RS5 < SR5;
input addSpace = no;
AddLabel(addSpace," ", Color.CURRENT);
AddLabel(DailyFastAvg > DailySlowAvg,ticker + " " + aggDisplay + bullEmoji,if strong then GlobalColor("darkgreen") else GlobalColor("green"));
AddLabel(DailyFastAvg < DailySlowAvg,ticker + " " + aggDisplay + bearEmoji,if weak then GlobalColor("darkred") else GlobalColor("red"));
AddLabel(DailyFastAvg2 > DailySlowAvg2,ticker2 + " " + aggDisplay + bullEmoji,if strong1 then GlobalColor("darkgreen") else GlobalColor("green"));
AddLabel(DailyFastAvg2 < DailySlowAvg2,ticker2 + " " + aggDisplay + bearEmoji,if weak1 then GlobalColor("darkred") else GlobalColor("red"));
AddLabel(DailyFastAvg3 > DailySlowAvg3,ticker3 + " " + aggDisplay + bullEmoji,if strong2 then GlobalColor("darkgreen") else GlobalColor("green"));
AddLabel(DailyFastAvg3 < DailySlowAvg3,ticker3 + " " + aggDisplay + bearEmoji,if weak2 then GlobalColor("darkred") else GlobalColor("red"));
AddLabel(DailyFastAvg4 > DailySlowAvg4,ticker4 + " " + aggDisplay + bullEmoji,if strong3 then GlobalColor("darkgreen") else GlobalColor("green"));
AddLabel(DailyFastAvg4 < DailySlowAvg4,ticker4 + " " + aggDisplay + bearEmoji,if weak3 then GlobalColor("darkred") else GlobalColor("red"));
AddLabel(DailyFastAvg5 > DailySlowAvg5,ticker5 + " " + aggDisplay + bullEmoji,if strong4 then GlobalColor("darkgreen") else GlobalColor("green"));
AddLabel(DailyFastAvg5 < DailySlowAvg5,ticker5 + " " + aggDisplay + bearEmoji,if weak4 then GlobalColor("darkred") else GlobalColor("red"));
AddLabel(DailyFastAvg6 > DailySlowAvg6,ticker6 + " " + aggDisplay + bullEmoji,if strong5 then GlobalColor("darkgreen") else GlobalColor("green"));
AddLabel(DailyFastAvg6 < DailySlowAvg6,ticker6 + " " + aggDisplay + bearEmoji,if weak5 then GlobalColor("darkred") else GlobalColor("red"));


 and
and  are the ones I've used above but will simply print the symbol in the appropriate color if you do not add them.