rlohmeyer
Active member
Thanks to the rather brilliant code by @korygill for locating the first and last bar of the day located HERE and @Svanoy for relative volume located HERE I was able to cobble together a relative opening range stats indicator, which I find helpful in trading the 30 minute opening range, which I find is reliably significant to day trade as support or resistance.
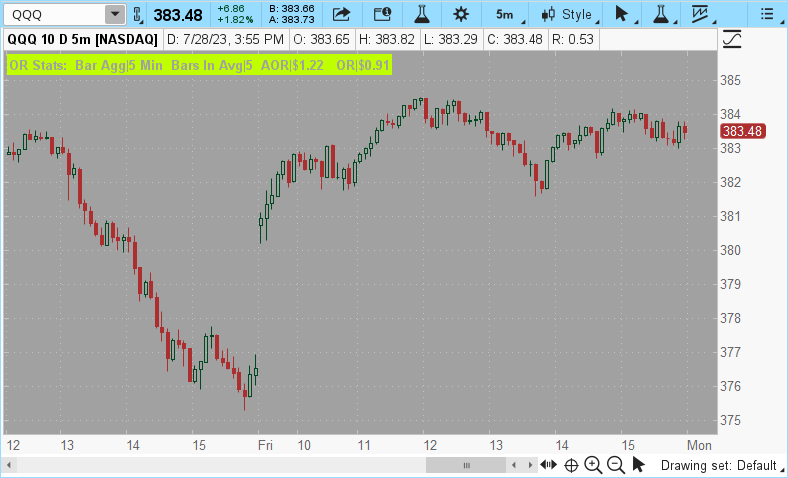
Below is an image of the Relative Opening Range Stats. And below that is the code. Notice on the chart the location of todays Opening Range and how price traded at this area (4/6/2022 Fed Day).

Below is an image of the Relative Opening Range Stats. And below that is the code. Notice on the chart the location of todays Opening Range and how price traded at this area (4/6/2022 Fed Day).
Code:
#first bar of day range
#Code Logic: Kory Gill, @korygill
def isRollover = GetYYYYMMDD() != GetYYYYMMDD()[1];
def beforeStart = GetTime() < RegularTradingStart(GetYYYYMMDD());
def afterEnd = GetTime() > RegularTradingEnd(GetYYYYMMDD());
def firstBarOfDay = if (beforeStart[1] == 1 and beforeStart == 0) or (isRollover and beforeStart == 0) then 1 else 0;
input ag = aggregationPeriod.five_MIN;
def rng = if firstBarOfDay then round(high(period = ag)-low(period = ag),2) else rng[1];

#avg range of x days back
#Code Logic @Svanoy
input Number_Of_Values = 5;
def Value = rng;
def NotToday = GetDay() <> GetLastDay();
def cond = (secondsFromTime(0930)==0) and NotToday;
def ValueCount = if cond then ValueCount[1] + 1 else ValueCount[1];
def bar = BarNumber();
def BarNum = if !IsNaN(close) and BarNumber()>0 then bar else BarNum[1];
def VBar = HighestAll(BarNum);
def FinalCount = fold b = 0 to VBar while !IsNaN(GetValue(close, -b)) do GetValue(ValueCount, -b);

def ValueRangeTotal;
if BarNumber() == 0 {ValueRangeTotal = 0;}
else if FinalCount - ValueCount < Number_Of_Values and cond
 {ValueRangeTotal = ValueRangeTotal[1] + Value;
} else {ValueRangeTotal = ValueRangeTotal[1];}

def RangeAverage = if (ValueRangeTotal /  Number_Of_Values) > 0 and (FinalCount - ValueCount) <= 0 then (ValueRangeTotal /  Number_Of_Values) else Double.NaN;

def Average = fold c = 0 to VBar while !IsNaN(GetValue(close, -c)) do GetValue(RangeAverage, -c);

addlabel(yes,"OR Stats: " + " Bar Agg|" + ag/60000 +" Min" + "  Bars In Avg|"+ Number_Of_Values +"  AOR|$"+round(average,2) + "   OR|$" + round(rng,2),color.LIME);