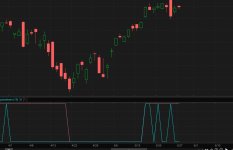
Hello, I have found some coding that is close to what I am looking for but not sure how to incorporate the recency of hitting an All Time High.
Simply put, I am just looking to create a script that checks a Daily chart over the last 500 trading days, that is looking for an New All Time High created in the last 15 days. I sued this code from a previous post to find if a stock is close to the All Time High but not sure how I can modify it (or create a new custom code) to find what i am looking for above...
Simply put, I am just looking to create a script that checks a Daily chart over the last 500 trading days, that is looking for an New All Time High created in the last 15 days. I sued this code from a previous post to find if a stock is close to the All Time High but not sure how I can modify it (or create a new custom code) to find what i am looking for above...
Code:
# Cond = at least 95%-99% of all time high that is from at least 6 to 52 weeks ago....and is now advancing towards all time high again.
def thisBar = if isNaN(close[-1]) and !isNaN(close)
then barNumber()
else thisBar[1];
def hhBar = if high == highest(high, 350)
then barNumber()
else hhBar[1];
def hh = if high == highest(high, 350)
then high
else hh[1];
plot Cond = highestAll(thisBar) - highestAll(hhBar) > 5 and
between(close, hh * .975, hh * .9995) and
isAscending(close, 5);
