Ruby:
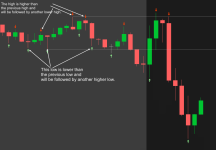
def Highest = if high[-1] is less than high && high[1] is less than high then high else Double.NaN;
def Lowest = if low[-1] is greater than low && low[1] is greater than low then low else Double.NaN;
def HighestBN = CompoundValue(1, if !IsNaN(Highest) then BarNumber() else HighestBN[1], 1);
def LowestBN = CompoundValue(1, if !IsNaN(Lowest) then BarNumber() else LowestBN[1], 1);
script WhiteBackCheck {
input est = 0;
input estBN = 0;
input HL = 0;
input value = 0;
def WBC = if !IsNaN(est)
then fold bh = 1 to estBN
with intbh = 0
while IsNaN(GetValue(est, bh))
do if HL then
if GetValue(est, bh + 1) < value
then 1
else 0
else
if GetValue(est, bh + 1) > value
then 1
else 0
else 0;
plot WhiteBackCheck = WBC;
}
script WhiteForwardCheck {
input est = 0;
input estBN = 0;
input HL = 0;
input value = 0;
def WFC = if !IsNaN(est)
then fold fh = 1 to estBN
with intfh = 0
while IsNaN(GetValue(est, -fh))
do if HL then
if GetValue(est, -fh - 1) < value
then 1
else 0
else
if GetValue(est, -fh - 1) > value
then 1
else 0
else 0;
plot WhiteForwardCheck = WFC;
}
def WHFC = WhiteForwardCheck(Highest,HighestBN,1,high);
def WHBC = WhiteBackCheck(Highest,HighestBN,1,high);
def WLFC = WhiteForwardCheck(Lowest,LowestBN,0,low);
def WLBC = WhiteBackCheck(Lowest,LowestBN,0,low);
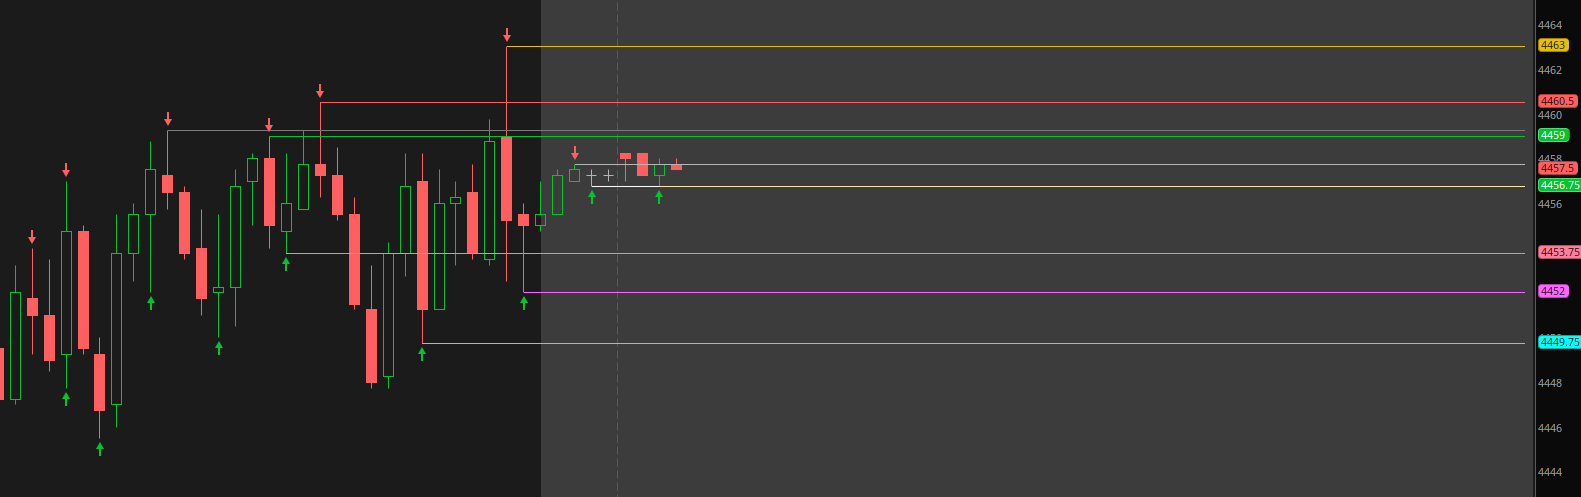
plot HH = Highest;
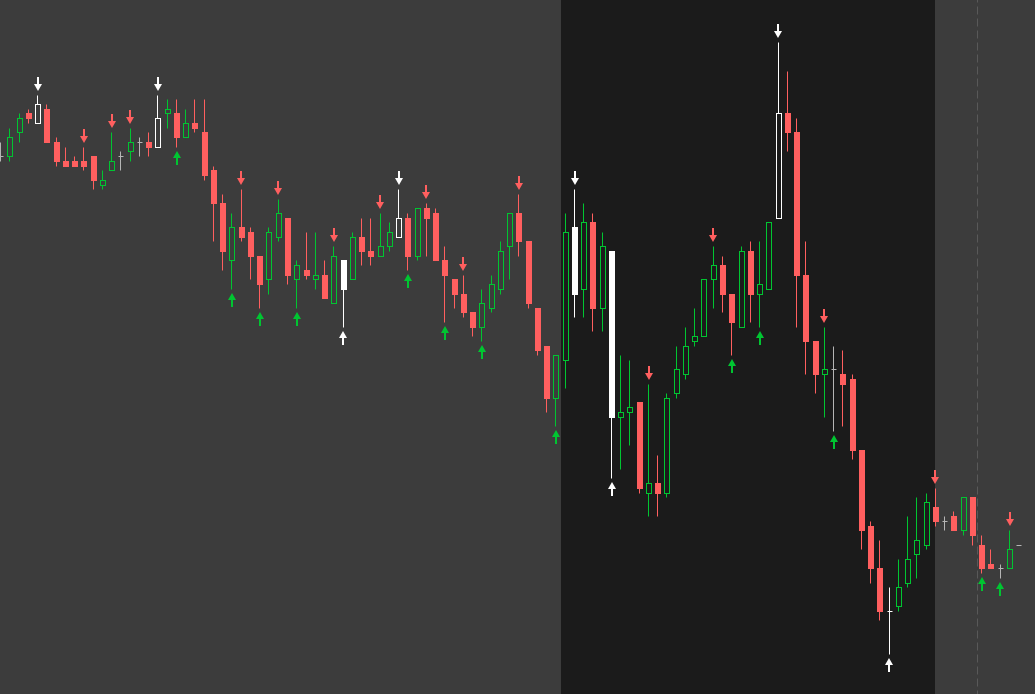
HH.SetPaintingStrategy(PaintingStrategy.BOOLEAN_ARROW_DOWN);
HH.SetLineWeight(1);
HH.AssignValueColor(if IsNaN(WHFC) then Color.DOWNTICK else if WHBC and WHFC then Color.WHITE else Color.DOWNTICK);
plot LL = Lowest;
LL.SetPaintingStrategy(PaintingStrategy.BOOLEAN_ARROW_UP);
LL.SetLineWeight(1);
LL.AssignValueColor(if IsNaN(WLFC) then Color.UPTICK else if WLBC and WLFC then Color.WHITE else Color.UPTICK);
AssignPriceColor(if (WHBC and WHFC) then Color.WHITE else Color.CURRENT);
AssignPriceColor(if (WLBC and WLFC) then Color.WHITE else Color.CURRENT);
Can any one help me see why this isn't plotting anything on a time frame less than 15mins?
def open_Fifteen_min;
def high_Fifteen_min;
def low_Fifteen_min;
def close_Fifteen_min;
def Volume_Fifteen_min;
if GetAggregationPeriod() <= AggregationPeriod.FIFTEEN_MIN{
open_Fifteen_min = open(period = AggregationPeriod.FIFTEEN_MIN);
high_Fifteen_min = high(period = AggregationPeriod.FIFTEEN_MIN);
low_Fifteen_min = low(period = AggregationPeriod.FIFTEEN_MIN);
close_Fifteen_min = close(period = AggregationPeriod.FIFTEEN_MIN);
Volume_Fifteen_min = volume(period = AggregationPeriod.FIFTEEN_MIN);
} else {
open_Fifteen_min = Double.NaN;
high_Fifteen_min = Double.NaN;
low_Fifteen_min = Double.NaN;
close_Fifteen_min = Double.NaN;
Volume_Fifteen_min = Double.NaN;
}
def Highest = if high_Fifteen_min[-1] is less than high_Fifteen_min && high_Fifteen_min[1] is less than high_Fifteen_min then high_Fifteen_min else Double.NaN;
def Lowest = if low_Fifteen_min[-1] is greater than low_Fifteen_min && low_Fifteen_min[1] is greater than low_Fifteen_min then low_Fifteen_min else Double.NaN;
def HighestBN = CompoundValue(1, if !IsNaN(Highest) then BarNumber() else HighestBN[1], 1);
def LowestBN = CompoundValue(1, if !IsNaN(Lowest) then BarNumber() else LowestBN[1], 1);
script WhiteBackCheck {
input est = 0;
input estBN = 0;
input HL = 0;
input value = 0;
def WBC = if !IsNaN(est)
then fold bh = 1 to estBN
with intbh = 0
while IsNaN(GetValue(est, bh))
do if HL then
if GetValue(est, bh + 1) < value
then 1
else 0
else
if GetValue(est, bh + 1) > value
then 1
else 0
else 0;
plot WhiteBackCheck = WBC;
}
script WhiteForwardCheck {
input est = 0;
input estBN = 0;
input HL = 0;
input value = 0;
def WFC = if !IsNaN(est)
then fold fh = 1 to estBN
with intfh = 0
while IsNaN(GetValue(est, -fh))
do if HL then
if GetValue(est, -fh - 1) < value
then 1
else 0
else
if GetValue(est, -fh - 1) > value
then 1
else 0
else 0;
plot WhiteForwardCheck = WFC;
}
def WHFC = WhiteForwardCheck(Highest,HighestBN,1,high_Fifteen_min);
def WHBC = WhiteBackCheck(Highest,HighestBN,1,high_Fifteen_min);
Plot HH_Swing = WHFC && WHBC;
HH_Swing.SetPaintingStrategy(PaintingStrategy.BOOLEAN_ARROW_DOWN);
HH_Swing.SetLineWeight(1);
HH_Swing.SetDefaultColor(color.White);
def WLFC = WhiteForwardCheck(Lowest,LowestBN,0,low_Fifteen_min);
def WLBC = WhiteBackCheck(Lowest,LowestBN,0,low_Fifteen_min);
Plot LL_Swing = WLFC && WLBC;
LL_Swing.SetPaintingStrategy(PaintingStrategy.BOOLEAN_ARROW_UP);
LL_Swing.SetLineWeight(1);
LL_Swing.SetDefaultColor(color.White);