
Cribbage
Member
I thought I'd share a tool I like to use for back-testing and ask for help altering part of it if possible. I have been editing one of Halcyon Guy's indicators for marking the different Globex sessions. I'd cut and pasted so much that it got messy and I just made this pared down version.
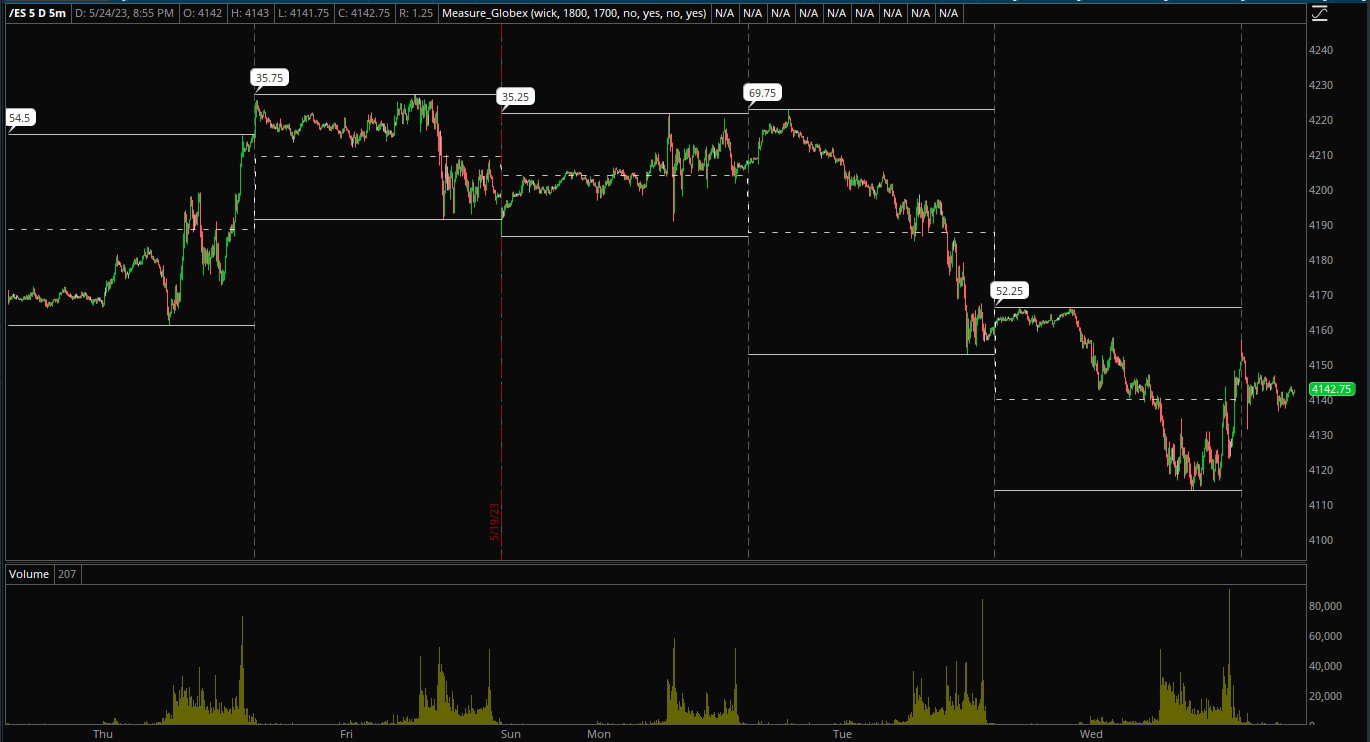
This indicator is for measuring specific time ranges of your choice. If there are multiple time ranges you want to use it on, I recommend you make copies and just change the colors so you know what's what. It marks start and end time, highs/lows (can choose bodies or wicks), the midline, the total range length, and 3 standard deviations.
I would like it if someone could help me color the candles within a range. In other words, Can someone help me make all the candles within the designated range a single color?
Here is Halcyon Guy's original script: https://usethinkscript.com/threads/...raday-futures-for-thinkorswim.2087/post-58176
Here is the ToS link: http://tos.mx/TExHsGt
And the Think Script:
Code:
## Range Measuring Tool ##
## Original code by HalcyonGuy, altered by Cribbage to be more speciic ##
## Original Code Link: https://usethinkscript.com/threads/draw-an-overnight-box-on-intraday-futures-for-thinkorswim.2087/post-58176##

declare hide_on_daily;

input candle_levels = {default "wick" , "body"};

input start1_est = 1800;
input end1_est = 500;
def start1 = start1_est;
def end1 = end1_est;

input show_start_end_vertical_lines = yes;
def ssevl = show_start_end_vertical_lines;

DefineGlobalColor("v", Color.WHITE);

def na = Double.NaN;
def bn = BarNumber();

# chg
def wickht = high - low;

# ---- wicks or body -------------------
def highx;
def lowx;
switch (candle_levels) {
case "wick":
    highx = high;
    lowx = low;
case "body":
    highx = Max( open, close);
    lowx = Min( open, close);
}

# reassign hi lo  to new vars
def hi = highx;
def lo = lowx;
def lastbar = !isnan(close[0]) and isnan(close[-1]);

# ----------------------------------------

input show_mid = yes;
input show_StDevs = yes;

# -----------------------------------------------

#  calc total minutes , from midnight , to each time
def start1hr = Floor(start1 / 100);
def start1min = start1 - (start1hr * 100);
def start1minttl = (start1hr * 60) + start1min;

def end1hr = Floor(end1 / 100);
def end1min = end1 - (end1hr * 100);
def end1minttl = (end1hr * 60) + end1min;

# ===========================>>>>>>>>>>>>>>>>>>>>

#  elapsed min in current period
def stmin2 = SecondsFromTime(start1);
def stmin = stmin2 / (60);

# ===========================>>>>>>>>>>>>>>>>>>>

#  is bar in a time period? , minutes in a day , 24 x 60 = 1440
def daymin = 1440;
def endz = 2359;
def startz = 0000;
def  first1 = if SecondsTillTime(start1) == 0 then 1 else 0;
def  last1 = if SecondsFromTime(end1) == 0 then 1 else 0;

def period1min;
def period1;
if start1minttl > end1minttl
then {
   # spans midnight , period=(24-start)+end , end to start
    period1min = (daymin - start1minttl) + end1minttl;
    period1 = if ((SecondsFromTime(start1) >= 0 and SecondsTillTime(endz) > 0) or ( SecondsFromTime(startz) >= 0 and SecondsTillTime(end1) > 0)) then 1 else 0;
} else {
   # ok , period=end-start , start to end
    period1min = (end1minttl - start1minttl);
    period1 = if SecondsFromTime(start1) >= 0 and SecondsTillTime(end1) > 0 then 1 else 0;
}

# ====================================

AddVerticalLine(ssevl and first1, "", GlobalColor("V"), Curve.MEDIUM_DASH);
AddVerticalLine(ssevl and last1, "", GlobalColor("V"), Curve.MEDIUM_DASH);

# get chart agg minutes
def chagg = GetAggregationPeriod();
def aggmin = chagg / (1000 * 60);

# calc qty of bars of period1, for the current chart time
def period1bars = period1min / aggmin;

# =====================<<<<<<<<<<<<<<<<<<<<<<

#  add check if in period and if last bar
def currentperiodbars = if (period1 and lastbar) then (stmin / aggmin) else 0;

#  find the high of active period, only on last bar
def xhi = fold xi = 0 to currentperiodbars
    with n = hi
    do Max(n, GetValue(hi, xi));

#  find the low of active period, only on last bar
def xlo = fold xj = 0 to currentperiodbars
    with m = lo
    do Min(m, GetValue(lo, xj));

def len = period1bars - 1;

# find high value for previous/complete time period, draw a line
def hi2 = if first1 then Highest(hi[-len], len + 1)
   else if last1 then na
   else if period1 then hi2[1]
   else na;

plot hiline = hi2;
hiline.SetDefaultColor(GlobalColor("V"));
#hiline.SetStyle(Curve.MEDIUM_DASH);
hiline.SetLineWeight(1);
hiline.HideBubble();

# ------------------------------------------------
# find low value for previous/complete time period, draw a line

def lo2 = if first1 then Lowest(lo[-len], len + 1)
   else if last1 then na
   else if period1 then lo2[1]
   else na;

plot loline = lo2;
loline.SetDefaultColor(GlobalColor("V"));
#loline.SetStyle(Curve.MEDIUM_DASH);
loline.SetLineWeight(1);
loline.HideBubble();

# ---------------------------------------------
# Cribbage Start

input show_range_length = YES;
def PRangeL = hiline - loline;

AddChartBubble(show_range_length and first1, hiline, PRangeL,
GlobalColor("V"), yes);

# Cribbage End
# ---------------------------------------------

##CRIBBAGE MIDLINE AND STANDARD DEVIATIONS START##

#Midline#
def MidLine = (PRangeL / 2) + loline;
plot middle = if show_mid then MidLine else na;

middle.SetDefaultColor(GlobalColor("V"));
middle.SetStyle(Curve.SHORT_DASH);

#Extension doesn't work, but would be nice
#def ExtendMid = Midline;
#Def ExtM1 = Midline + 1;
#Def ExtM2 = Midline + 2;
#Def ExtM3 = Midline + 3;

#Standard Deviations#

#Highs#
def SD1 = PRangeL + hiline;
def SD2 = (PRangeL * 2) + hiline;
def SD3 = (PRangeL * 3) + hiline;

plot SDLine1 = if show_StDevs then SD1 else na;
SDLine1.SetDefaultColor(GlobalColor("V"));
SDLine1.SetStyle(Curve.SHORT_DASH);

plot SDLine2 = if show_StDevs then SD2 else na;
SDLine2.SetDefaultColor(GlobalColor("V"));
SDLine2.SetStyle(Curve.SHORT_DASH);

plot SDLine3 = if show_StDevs then SD3 else na;
SDLine3.SetDefaultColor(GlobalColor("V"));
SDLine3.SetStyle(Curve.SHORT_DASH);

#Lows#
def SD4 = loline - PRangeL;
def SD5 = loline - (PRangeL * 2);
def SD6 = loline - (PRangeL * 3);

plot SDLine4 = if show_StDevs then SD4 else na;
SDLine4.SetDefaultColor(GlobalColor("V"));
SDLine4.SetStyle(Curve.SHORT_DASH);

plot SDLine5 = if show_StDevs then SD5 else na;
SDLine5.SetDefaultColor(GlobalColor("V"));
SDLine5.SetStyle(Curve.SHORT_DASH);

plot SDLine6 = if show_StDevs then SD6 else na;
SDLine6.SetDefaultColor(GlobalColor("V"));
SDLine6.SetStyle(Curve.SHORT_DASH);

##CRIBBAGE MIDLINE AND STANDARD DEVIATIONS END##