mbarcala
Active member
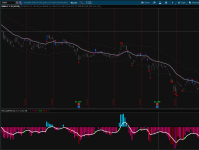
I bring here a combination of two good indicators as the QQE/RSI. I saw few ideas like this online and I really like them when they get combined, it gives you a nice entry points if you want to use it. As I always said if you try it, post some feedbacks or comments!
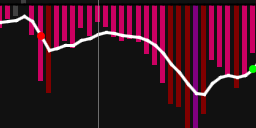
QQE signal it's represent by a white line and RSI as Histogram with color levels!
Updates:
I updated more the QQE/RSI indicator so you can understand more since I moved from the original range to have 0 in the middle line.
I updated the QQE Signal so you can see when the fast lane cross with the QQE.
RSI level: 20 = 70 and 30 = 80.
Upper Indicator here: https://usethinkscript.com/threads/break-keltner-bands-bkb-for-thinkorswim.11220/
Photos
14754[/ATTACH]']


script
QQE signal it's represent by a white line and RSI as Histogram with color levels!
Updates:
I updated more the QQE/RSI indicator so you can understand more since I moved from the original range to have 0 in the middle line.
I updated the QQE Signal so you can see when the fast lane cross with the QQE.
RSI level: 20 = 70 and 30 = 80.
Upper Indicator here: https://usethinkscript.com/threads/break-keltner-bands-bkb-for-thinkorswim.11220/
Photos
14754[/ATTACH]']
script
Code:
# QQE/RSI Indicator by mbarcala

declare lower;

input RSI_Period = 20;
input Slow_Factor = 5;
input length = 14;
input level1 = 20;
input level2 = 30;

def RSIndex = 4.236;
def Wilder_Period = RSI_Period * 2 - 1;
def rsi = RSI(price = close, length = RSI_Period).RSI;

plot QQE = ExpAverage(rsi, Slow_Factor) - 50;
QQE.SetDefaultColor(Color.WHITE);
QQE.SetLineWeight(3);
QQE.HideBubble();
QQE.HideTitle();

def atr_rsi = AbsValue(QQE[1] - QQE);
def atr_rsi_ma = ExpAverage(atr_rsi, Wilder_Period);
def DeltaFastAtrRsi = ExpAverage(atr_rsi_ma, Wilder_Period) * RSIndex;
def newshortband =  QQE + DeltaFastAtrRsi;
def newlongband = QQE - DeltaFastAtrRsi;

def longband = if QQE[1] > longband[1] and QQE > longband[1] then max(longband[1],newlongband) else newlongband;
def shortband = if QQE[1] < shortband[1] and  QQE < shortband[1] then min(shortband[1], newshortband) else newshortband;
def trend = if Crosses(QQE, shortband[1]) then 1 else if Crosses(longband[1], QQE) then -1 else if !IsNAN(trend[1]) then trend[1] else 1;

plot Zero = 0;
Zero.SetDefaultColor(Color.BLACK);
Zero.SetLineWeight(2);

def pFastAtrRsiTL = if trend == 1 then longband else shortband;

#### RSI2 #####
def NetChgAvg = WildersAverage(close - close[1], length);
def TotChgAvg = WildersAverage(AbsValue(close - close[1]), length);
def ChgRatio = if TotChgAvg != 0 then NetChgAvg / TotChgAvg else 0;

plot RSI2 = 50 * (ChgRatio + 1) - 50;
RSI2.SetPaintingStrategy(PaintingStrategy.HISTOGRAM);
RSI2.AssignValueColor(if RSI2 > 3 and RSI2 < level1 then CreateColor(0,198,244) else
                      if RSI2 >= level1 and RSI2 < level2 then CreateColor(0,101,255) else
                      if RSI2 >= level2 then Color.BLUE else
                      if RSI2 < -3 and RSI2 > -level1 then CreateColor(204,0,98) else
                      if RSI2 <= -level1 and RSI2 > -level2 then Color.DARK_RED else
                      if RSI2 <= -level2 then Color.PLUM else Color.DARK_GRAY);
RSI2.SetLineWeight(5);
#### RSI END #####

plot upSign = if QQE crosses above pFastAtrRsiTL then QQE else Double.NaN;
upSign.SetPaintingStrategy(PaintingStrategy.POINTS);
upSign.SetDefaultColor(Color.GREEN);
upSign.SetLineWeight(5);

plot dnSign = if QQE crosses below pFastAtrRsiTL then QQE else Double.NaN;
dnSign.SetPaintingStrategy(PaintingStrategy.POINTS);
dnSign.SetDefaultColor(Color.RED);
dnSign.SetLineWeight(5);
Attachments

Last edited by a moderator: