@$Jdoc member request:
https://usethinkscript.com/threads/convert-tradingview-qqe-mt4-glaz-modified-by-justunclel.13338/
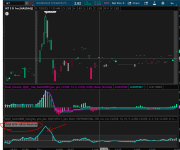
below is the QQE suite has all options with additional RSI types and bar color. Try it!
https://usethinkscript.com/threads/convert-tradingview-qqe-mt4-glaz-modified-by-justunclel.13338/
below is the QQE suite has all options with additional RSI types and bar color. Try it!
CSS:
# QQE Suite - QQE mod and QQE MT4 with different RSI Types
# Created by Sam4Cok@Samer800 - 11/2022

declare lower;
input ShowLabel       = yes;
input BarColor        = yes;
input SignalBarColor  = yes;
input qqeType = {default "QQE Mod1", "QQE Mod2", "QQE MT4-1", "QQE MT4-2"};
input ShowRSILine     = yes;
input QqeStyle        = {default Histogram, Line, Both};
input RsiMaType       = AverageType.EXPONENTIAL;
input RSI_Type        = {default RSI, RSX, AdaptiveRSI};
input RSICrossQQE     = no;
input RSICrossZero    = no;
input mt4Source       = close;
input mt4Length       = 14;
input mt4Threshold    = 10;
input mt4Smoothing    = 5;
input mt4QqeFactor    = 4.238;
input RSI_Source       = close;
input RSI_Length       = 6;
input RSI_Smoothing    = 5;
input Fast_QQE_Factor  = 3.0;
input RSI_Source2      = close;
input RSI_Length2      = 6;
input RSI_Smoothing2   = 5;
input Fast_QQE_Factor2 = 1.61;
input qqeModThreshold  = 3;
input BandType         = {Sticky,default NonSticky};
input BbMaType        = AverageType.SIMPLE;
input BandLength       = 50;
input BandMultiplier   = 0.35;

#### Color
DefineGlobalColor("UP", CreateColor(51, 207, 255));
DefineGlobalColor("UP Weak", CreateColor(0, 117, 153));
DefineGlobalColor("DN", CreateColor(255, 0, 98));
DefineGlobalColor("DN Weak", CreateColor(204, 0, 78));

DefineGlobalColor("UpMT", CreateColor(76, 175, 80));
DefineGlobalColor("UpWeakMT", Color.DARK_GREEN);
DefineGlobalColor("DnMT", Color.RED);
DefineGlobalColor("DnWeakMT", CreateColor(163, 0, 0));
DefineGlobalColor("NeutralMT", CreateColor(255, 127, 0));
def na = Double.NaN;
def qqType = if qqeType == qqeType."QQE Mod1" then 1 else
             if qqeType == qqeType."QQE Mod2" then 2 else
             if qqeType == qqeType."QQE MT4-1" then -1 else -2;
def Style = if QqeStyle == QqeStyle.Histogram then 1 else
            if QqeStyle == QqeStyle.Line then -1 else 0;
def sticky  = if BandType == BandType.Sticky then 1 else 0;
#####  Script
script nz {
    input data         = 0;
    input replacement  = 0;
    def ret_val = if IsNaN(data) then replacement else data;
    plot return = ret_val;
}
script rsx {
    input src = close;
    input rsxLength = 7;
    def f8 = 100 * src;
    def f10 = nz(f8[1], f8);
    def v8 = f8 - f10;
    def f18 = 3 / (rsxLength + 2);
    def f20 = 1 - f18;
    def f28 = f20 * nz(f28[1]) + f18 * v8;
    def f30 = f18 * f28 + f20 * nz(f30[1]);
    def vC = f28 * 1.5 - f30 * 0.5;
    def f38 = f20 * nz(f38[1]) + f18 * vC;
    def f40 = f18 * f38 + f20 * nz(f40[1]);
    def v10 = f38 * 1.5 - f40 * 0.5;
    def f48 = f20 * nz(f48[1]) + f18 * v10;
    def f50 = f18 * f48 + f20 * nz(f50[1]);
    def v14 = f48 * 1.5 - f50 * 0.5;
    def f58 = f20 * nz(f58[1]) + f18 * AbsValue(v8);
    def f60 = f18 * f58 + f20 * nz(f60[1]);
    def v18 = f58 * 1.5 - f60 * 0.5;
    def f68 = f20 * nz(f68[1]) + f18 * v18;
    def f70 = f18 * f68 + f20 * nz(f70[1]);
    def v1C = f68 * 1.5 - f70 * 0.5;
    def f78 = f20 * nz(f78[1]) + f18 * v1C;
    def f80 = f18 * f78 + f20 * nz(f80[1]);
    def v20 = f78 * 1.5 - f80 * 0.5;
    def f88;
    def f90_ = if nz(f90_[1]) == 0 then 1 else
           if nz(f88[1]) <= nz(f90_[1]) then nz(f88[1]) + 1 else nz(f90_[1]) + 1;
    f88 = if nz(f90_[1]) == 0 and (rsxLength - 1 >= 5) then rsxLength - 1 else 5;
    def f0 = if f88 >= f90_ and f8 != f10 then 1 else 0;
    def f90 = if f88 == f90_ and f0 == 0 then 0 else f90_;
    def v4_ = if f88 < f90 and v20 > 0 then (v14 / v20 + 1) * 50 else 50;
    def rsx = if v4_ > 100 then 100 else if v4_ < 0 then 0 else v4_;
    plot return = rsx;
}
script AdpRSI {
    input src = close;
    input length = 20;
    def ama;
    def alpha = AbsValue(RSI(Price = src - ama[1], Length = length) / 100 - 0.5);
    ama     = nz(ama[1] + Power(alpha, 1) * (src - ama[1]), src);
    def trigger = ExpAverage(RSI(Price = ExpAverage(src, length / 2), Length = length), length / 2);
    plot retrun = trigger;
}
#getStickyRange(highsource, lowsource, upper, lower, sticky=false)=>
script getStickyRange {
    input highsource = high;
    input lowsource = low;
    input upper = high;
    input lower = low;
    input sticky = no;
    def newUpper;
    def newLower;
    newUpper = if IsNaN(newUpper[1]) then upper else
        if highsource[1] >= newUpper[1] or lowsource[1] <= newLower[1] or !sticky
           then upper else nz(newUpper[1], upper);
    newLower = if IsNaN(newLower[1]) then lower else
        if highsource[1] >= newUpper[1] or lowsource[1] <= newLower[1] or !sticky
           then lower else nz(newLower[1], lower);
    plot UpBand = newUpper;
    plot LoBand = newLower;
}
#qqeLine(matype, src, len, qqe) =>
script qqe1 {
    input matype = yes;
    input _Rsi = 50;
    input RSI_Length = 6;
    input qqe = 4.236;
    def RsiMa = _Rsi;
    def Wilders_period = RSI_Length * 2 - 1;
    def AtrRsi   = AbsValue(RsiMa[1] - RsiMa);
    def MaAtrRsi = MovingAverage(matype, AtrRsi, Wilders_period);
    def dar      = MovingAverage(matype, MaAtrRsi, Wilders_period) * qqe;
    def longband; def shortband; def trend;
    def DeltaFastAtrRsi = dar;
    def newshortband = RsiMa + DeltaFastAtrRsi;
    def newlongband  = RsiMa - DeltaFastAtrRsi;
        longband  = if RsiMa[1] > longband[1] and RsiMa > longband[1] then
                    Max(longband[1], newlongband) else newlongband;
        shortband = if RsiMa[1] < shortband[1] and RsiMa < shortband[1] then
                    Min(shortband[1], newshortband) else newshortband;
    def cross_1  = (RsiMa Crosses shortband[1]);
    def cross_11 = (longband[1] Crosses RsiMa);
        trend = if cross_1 then 1 else if cross_11 then -1 else If(IsNaN(trend[1]), 1, trend[1]);
    def FastAtrRsiTL = if trend == 1 then longband else shortband;
    plot return = FastAtrRsiTL;
}
#qqeLine(src, len, sf, qqe) =>
script qqe2 {
    input matype = yes;
    input _Rsi = 50;
    input RSI_Length = 6;
    input qqe = 4.236;
    def RsiMa = _Rsi;
    def Wilders_period = RSI_Length * 2 - 1;
    def AtrRsi = AbsValue(RsiMa - RsiMa[1]);
    def MaAtrRsi = MovingAverage(matype, AtrRsi, Wilders_period);
    def dar      = MovingAverage(matype, MaAtrRsi, Wilders_period) * qqe;
    def DeltaRsi = dar;
    def shortband = RsiMa + DeltaRsi;
    def longband  = RsiMa - DeltaRsi;
    def trend;
    trend = if RsiMa > nz(trend[1]) then
            If(longband < trend[1], trend[1], longband) else
            If(shortband > trend[1], trend[1], shortband);
    plot retun = trend;
}
#-- RSI Calc
def RsiMod  = RSI(PRICE = RSI_Source, LENGTH = RSI_Length);
def RsiMT   = RSI(PRICE = mt4Source, LENGTH = mt4Length);
def rsxMod  = rsx(RSI_Source, RSI_Length);
def rsxMT   = rsx(mt4Source, mt4Length);
def cRSIMod = AdpRSI(RSI_Source, RSI_Length);
def cRSIMt  = AdpRSI(mt4Source, mt4Length);
#--- QQE 1
def Rsi1 = If(qqType > 0, RsiMod, RsiMT);
def rsx1  = If(qqType > 0, rsxMod, rsxMT);
def cRS1 = If(qqType > 0, cRSIMod, cRSIMt);
def rsiSmoothing = If(qqType > 0, RSI_Smoothing, mt4Smoothing);
def rsiType = if RSI_Type == RSI_Type.RSI then Rsi1 else
              if RSI_Type == RSI_Type.RSX then rsx1 else cRS1;
def MaRsi = MovingAverage(RsiMaType, rsiType, rsiSmoothing);
def AtrFastRsiTL = if qqType == 1 then
            qqe1(RsiMaType, MaRsi, RSI_Length, Fast_QQE_Factor) else
         if qqType == 2 then
            qqe2(RsiMaType, MaRsi, RSI_Length, Fast_QQE_Factor) else
         if qqType == -1 then
            qqe1(RsiMaType, MaRsi, mt4Length, mt4QqeFactor) else
            qqe2(RsiMaType, MaRsi, mt4Length, mt4QqeFactor);
def RsiMa = MaRsi;
def FastAtrRsiTL = AtrFastRsiTL;
# QQE 2
def cRSI2 = AdpRSI(RSI_Source2, RSI_Length2);
def Rsi2 = RSI(PRICE = RSI_Source2, LENGTH = RSI_Length2);
def rsx2 = rsx(RSI_Source2, RSI_Length2);
def rsiType2 = if RSI_Type == RSI_Type.RSI then Rsi2 else
               if RSI_Type == RSI_Type.RSX then rsx2 else cRSI2;
def MaRsi2 = MovingAverage(RsiMaType, rsiType2, RSI_Smoothing2);
def AtrFastRsiTL2 = if qqType < 0 then na else
                    if qqType == 1 then qqe1(RsiMaType, MaRsi2, RSI_Length2, Fast_QQE_Factor2) else
                                        qqe2(RsiMaType, MaRsi2, RSI_Length2, Fast_QQE_Factor2);
def RsiMa2 = MaRsi2;
def FastAtrRsiTL2 = AtrFastRsiTL2;
# Bands Cals
#--- BB
def lsrc = FastAtrRsiTL - 50;
def basis = MovingAverage(BbMaType, lsrc, BandLength);
def dev   = BandMultiplier * StDev(lsrc, BandLength);
def BbUp  = basis + dev;
def BbLo  = basis - dev;
def BBupper = getStickyRange(basis, basis, BbUp, BbLo, sticky).Upband;
def BBlower = getStickyRange(basis, basis, BbUp, BbLo, sticky).Loband;
def upper = BBupper;
def lower = BBlower;
# Plots
plot Zero = if IsNaN(close) then na else 0;
Zero.SetDefaultColor(Color.GRAY);

#// Find all the QQE Crosses
# Ups and Downs
def maMOD   = RsiMa2 - 50;
def maMT4   = RsiMa - 50;
def FastRsiMOD  = FastAtrRsiTL2 - 50;
def FaastRsiMT4 = FastAtrRsiTL - 50;
def RSIndex = If(qqType > 0, RsiMa2, RsiMa);
def QqeRsi  = If(qqType > 0, FastRsiMOD, FaastRsiMT4);
def QqeMa   = If(qqType > 0, maMOD, maMT4);

def Threshold  = If(qqType > 0, qqeModThreshold, mt4Threshold);
#def color22 = if QqeMa > Threshold then 1 else if QqeMa < -Threshold then -1 else 0;
def Greenbar1 = QqeMa > Threshold;
def Greenbar2 = maMT4 > upper;
def Redbar1   = QqeMa < -Threshold;
def Redbar2   = maMT4 < lower;
def UpStrong  = Greenbar1 and Greenbar2;
def DnStrong  = Redbar1 and Redbar2;
def UnDecided = (Greenbar1 and !UpStrong) or (Redbar1 and !DnStrong);
def MTNormal  = Greenbar1 or Redbar1;

#---- RSI Plots
plot ATRLine = if !ShowRSILine then na else QqeRsi;
ATRLine.AssignValueColor(Color.WHITE);
ATRLine.SetLineWeight(3);

plot RsiLine = QqeMa;
RsiLine.AssignValueColor(CreateColor(0, 101, 255));
RsiLine.SetLineWeight(2);
RsiLine.SetHiding(if Style <= 0 then no else yes);

#--- OB/OS Levels
def hUpper = if IsNaN(close) then na else If(qqType > 0, 30, Threshold);
def hLower = if IsNaN(close) then na else If(qqType > 0, -30, -Threshold);

AddCloud(If(qqType > 0, na, hUpper), hLower, Color.DARK_GRAY, Color.DARK_GRAY, yes);
AddCloud(If(qqType < 0, na, Double.POSITIVE_INFINITY), hUpper, Color.DARK_GRAY, Color.DARK_GRAY, yes);
AddCloud(If(qqType < 0, na, hLower), Double.NEGATIVE_INFINITY, Color.DARK_GRAY, Color.DARK_GRAY, yes);

#-- PLot
def Hist1  = if !UpStrong or !Greenbar1 then 0 else QqeMa;
def Hist2  = if !DnStrong or !Redbar1 then 0 else QqeMa;
def Hist3   = if qqType > 0 then if !UnDecided then 0 else QqeMa else
              if MTNormal then 0 else QqeMa;

#--- Candles
def Updir = QqeMa > QqeMa[1];
def Dndir = QqeMa < QqeMa[1];

plot UpCandle = Hist1;
UpCandle.SetPaintingStrategy(PaintingStrategy.HISTOGRAM);
UpCandle.SetLineWeight(4);
UpCandle.SetDefaultColor(GlobalColor("UP"));
UpCandle.AssignValueColor(if qqType > 0 then
                          if Updir then GlobalColor("UP") else GlobalColor("UP Weak") else
                          if Updir then GlobalColor("UpMT") else GlobalColor("UpWeakMT"));
UpCandle.SetHiding(if Style >= 0 then no else yes);
plot DnCandle = Hist2;
DnCandle.SetPaintingStrategy(PaintingStrategy.HISTOGRAM);
DnCandle.SetLineWeight(4);
DnCandle.SetDefaultColor(GlobalColor("DN"));
DnCandle.AssignValueColor(if qqType > 0 then
                          if Dndir then GlobalColor("DN") else GlobalColor("DN Weak") else
                          if Dndir then GlobalColor("DnMT") else GlobalColor("DNWeakMT"));
DnCandle.SetHiding(if Style >= 0 then no else yes);
plot NoCandle = Hist3;
NoCandle.SetPaintingStrategy(PaintingStrategy.HISTOGRAM);
NoCandle.SetLineWeight(4);
NoCandle.AssignValueColor(if qqType > 0 then Color.DARK_GRAY else GlobalColor("NeutralMT"));
NoCandle.SetHiding(if Style >= 0 then no else yes);

#----- Crosses -----------------------

#def QQExlong  = if FastAtrRsiTL crosses above RSIndex then QQExlong[1] + 1  else 0;
#def QQExshort = if FastAtrRsiTL crosses below RSIndex then QQExshort[1] + 1 else 0;
def QQExlong  = if FastAtrRsiTL < RSIndex then QQExlong[1] + 1  else 0;
def QQExshort = if FastAtrRsiTL > RSIndex then QQExshort[1] + 1 else 0;
#// Zero cross
def QQEzlong  = if RSIndex >= 50 then QQEzlong[1] + 1 else 0;
def QQEzshort = if RSIndex < 50 then QQEzshort[1] + 1 else 0;
#// Thresh Hold channel Crosses give the BUY/SELL alerts.
def QQEclong  = if RSIndex>(50+Threshold) then QQEclong[1]+1 else 0;
def QQEcshort = if RSIndex<(50-Threshold) then QQEcshort[1]+1 else 0;
#// QQE crosses
plot QQE_CrossUP = if !RSICrossQQE then na else If(QQExlong == 1, FastAtrRsiTL[1] - 50, na);# "QQE XQ Cross Over"
QQE_CrossUP.SetPaintingStrategy(PaintingStrategy.POINTS);
QQE_CrossUP.SetDefaultColor(Color.BLUE);
QQE_CrossUP.SetLineWeight(4);
plot QQE_CrossDN = if !RSICrossQQE then na else If(QQExshort == 1, FastAtrRsiTL[1] - 50, na); # "QQE XQ Cross Under"
QQE_CrossDN.SetPaintingStrategy(PaintingStrategy.POINTS);
QQE_CrossDN.SetDefaultColor(Color.MAGENTA);
QQE_CrossDN.SetLineWeight(4);
#// Signal crosses zero line
plot QQE_ZeroUP = if !RSICrossZero then na else If(QQEzlong == 1, 0, na);  # "QQE XZ Zero Cross Over"
QQE_ZeroUP.SetPaintingStrategy(PaintingStrategy.TRIANGLES);
QQE_ZeroUP.SetDefaultColor(Color.GREEN);
QQE_ZeroUP.SetLineWeight(2);
plot QQE_ZeroDN = if !RSICrossZero then na else If(QQEzshort == 1, 0, na);# "QQE XZ Zero Cross Under"
QQE_ZeroDN.SetPaintingStrategy(PaintingStrategy.TRIANGLES);
QQE_ZeroDN.SetDefaultColor(Color.RED);
QQE_ZeroDN.SetLineWeight(2);

#-- Label
def ExUp = Hist1 and Updir;
def Up   = Hist1 and Dndir;
def ExDn = Hist2 and Dndir;
def Dn   = Hist2 and Updir;
def Nu   = Hist3;

AddLabel(ShowLabel and ExUp, qqeType + "(" + RSI_Type + ")" + "-Up Trending", Color.GREEN);
AddLabel(ShowLabel and Up,   qqeType + "(" + RSI_Type + ")" + "-Weak Up", Color.DARK_GREEN);
AddLabel(ShowLabel and ExDn, qqeType + "(" + RSI_Type + ")" + "-Down Trending", Color.RED);
AddLabel(ShowLabel and Dn,   qqeType + "(" + RSI_Type + ")" + "-Weak Down", Color.DARK_RED);
AddLabel(ShowLabel and Nu,   qqeType + "(" + RSI_Type + ")" + "-Neutral", Color.GRAY);
#--- Price Color
AssignPriceColor(
if (!BarColor and !SignalBarColor) then Color.CURRENT else
if (BarColor and SignalBarColor) then
                 if QQEclong == 2 then Color.BLUE else if QQEcshort == 2 then Color.MAGENTA else
                 if ExUp then Color.GREEN else
                 if Up   then Color.DARK_GREEN else
                 if ExDn then Color.RED else
                 if Dn then Color.DARK_RED else Color.GRAY else
if (BarColor and !SignalBarColor) then
                 if ExUp then Color.GREEN else
                 if Up   then Color.DARK_GREEN else
                 if ExDn then Color.RED else
                 if Dn   then Color.DARK_RED else Color.GRAY else
                 if QQEclong == 2 then Color.BLUE else
                 if QQEcshort == 2 then Color.MAGENTA else  Color.CURRENT);

#--- END CODE
Last edited by a moderator:
") The only way you will know what the plots are doing, is to observe them on your charts and how they inter-relate with your other indicators.
The only way you will know what the plots are doing, is to observe them on your charts and how they inter-relate with your other indicators.