johnwood34
Member
It's a psar macd script.
https://usethinkscript.com/threads/sar-macd-for-thinkorswim.15409/
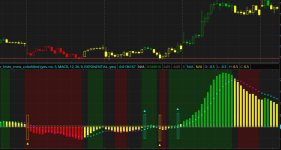
(Edited) Believe it includes a zero line cross signal but what i'd like to see is a ma cross signal. More specifically, a signal ONLY on the first histo bar to close above/below my signal line (see screenshot). I have included the script below. I'm colorblind, so when the histo changes from red to green/yellow and the signal line turns from blue/purple to white, I can no longer see the signal line . I would change the colors of the sig line myself but they're dynamically set, so if it could be tweaked to plot an arrow when, in a bullish scenario, once the sig line has turned white, the first histo bar closes above it. Bearish scenario, the sig line has turned purple/blue and the first histo bar to close below it...

https://usethinkscript.com/threads/sar-macd-for-thinkorswim.15409/
(Edited) Believe it includes a zero line cross signal but what i'd like to see is a ma cross signal. More specifically, a signal ONLY on the first histo bar to close above/below my signal line (see screenshot). I have included the script below. I'm colorblind, so when the histo changes from red to green/yellow and the signal line turns from blue/purple to white, I can no longer see the signal line . I would change the colors of the sig line myself but they're dynamically set, so if it could be tweaked to plot an arrow when, in a bullish scenario, once the sig line has turned white, the first histo bar closes above it. Bearish scenario, the sig line has turned purple/blue and the first histo bar to close below it...
Code:
#Author Message:
#SAR MACD is an idea of implementing Directional MACD with Parabolic SAR to exactly detect and confirm Trend. This p-SAR MACD consist of a #HYBRID MACD which acts as MACD TREND oscillator, MACD Oscillator, PSAR Indicator combined with MA line. thus Fake MACD Signals can be #eliminated using this SAR MACD. Sideways can be detected using Threshold Levels must be adjusted based on timeframe.

#Indicators Hybrid model contains:
#1.MACD (12,26,9) Standard with MA Crossovers
#2.MACD Trend
#3.Parabolic SAR with 0.02
#4.Threshold level - indicates Sideways

#How to use.
#Histogram:
#-> HIST MODE: normal MACD indicator
#MA Line Color is based on PSAR Direction Blue-Up/ Pink -Down
#A crossover upside with a Blue MA line denotes Up confirmation
#A Crossover downwards with a red MA line denotes Down Confirmation
#Additionally Histogram above zero line and below zero line are to be confirmed

#-> MACD MODE: MACD Trend indicator
#MA Line Color is based on PSAR Direction Blue-Up/ Pink -Down
#A crossover upside with a Blue MA line denotes Up confirmation
#A Crossover downwards with a red MA line denotes Down Confirmation
#Additionally Histogram above zero line and below zero denotes long term Trend

#-> Histogram Color: Indicates candles direction
#Yellow indicates Unconfirmed Direction
#Green Indicates up direction
#Red Indicates Down Direction


#Buy Condition:
#MA Color - Blue
#Histogram- Above Zero
#Histogram/Candle -Green
#MA Crossover is must
#Sell Condition:
#MA Color - Red
#Histogram- Below Zero
#Histogram/Candle -Red
#MA Cross under is must

#Warning: Must not be used as a standalone indicator. Use for confirmation of your Buy Sell Signals and Entry only.

#CODE:


#// https://www.tradingview.com/v/uXB6f9Y5/
#// © traderharikrishna
#indicator("SARMACD")
# Converted and mod by Sam4Cok@Samer800 - 05/2023

declare lower;
#declare real_size;

input ColorBars = yes;
input ShowSignals = no;
input sideways = 5;#,'sideways')
input GraphType = {default MACD, HIST}; # 'Graph Type'
input fastLength = 12;
input slowLength = 26;
input macdLength = 9;
input averageType = AverageType.EXPONENTIAL;

def na = Double.NaN;
def pos = Double.POSITIVE_INFINITY;
def neg = Double.NEGATIVE_INFINITY;
def last = isNaN(close);
def macdSel = GraphType==GraphType.MACD;
def HistSel = GraphType==GraphType.HIST;

def sar = ParabolicSAR();
def cross = crosses(close,sar);
def sa = if cross then close else sa[1];
def dir = if sar < close then 1 else -1;

def m = MovingAverage(averageType, close, fastLength) - MovingAverage(averageType, close, slowLength);
def s = MovingAverage(averageType, m, MACDLength);
def h = m - s;

def bc = if dir == 1 and close > sa and m>0 then 1 else
if dir == -1 and close < sa and m<0 then -1 else 0;
def hc = if dir == 1 and close > sa and h>0 then 1 else
if dir == -1 and close < sa and h<0 then -1 else 0;

plot SigLine = s;
plot Hist = if HistSel then m else na;
plot macd = if macdSel then m else h;

macd.SetLineWeight(3);
macd.SetPaintingStrategy(PaintingStrategy.HISTOGRAM);
macd.AssignValueColor(if macdSel then
if bc>0 then CreateColor(1, 185, 7) else
if bc<0 then CreateColor(224, 4, 4) else Color.YELLOW else
if hc>0 then CreateColor(1, 185, 7) else
if hc<0 then CreateColor(224, 4, 4) else Color.YELLOW);
Hist.SetLineWeight(2);
Hist.SetDefaultColor(Color.WHITE);
SigLine.SetStyle(Curve.POINTS);
SigLine.AssignValueColor(if dir==1 then Color.CYAN else Color.MAGENTA);

plot limitUp = if last then na else TickSize() * sideways;
plot limitDn = if last then na else TickSize() * -sideways;
plot Mid = if last then na else 0; # 'Zero line'

limitUp.SetDefaultColor(Color.GRAY);
limitDn.SetDefaultColor(Color.GRAY);
mid.SetDefaultColor(Color.GRAY);
limitUp.SetPaintingStrategy(PaintingStrategy.DASHES);
limitDn.SetPaintingStrategy(PaintingStrategy.DASHES);

# Background
def buy_ = h>0 and dir==1;
def sell_= h<0 and dir==-1;

AddCloud(if buy_ then pos else na, neg, Color.DARK_GREEN);
AddCloud(if sell_ then pos else na, neg, Color.DARK_REd);

#-- Alerts
#def buy = h>0 and dir==1 and dir[1]==-1;
#def sell = h<0 and dir==-1 and dir[1]==1;

def buy = Hist crosses above SigLine;
def sell = Hist crosses below SigLine;

AddChartBubble(ShowSignals and buy, macd, "B", Color.GREEN, no);
AddChartBubble(ShowSignals and sell, macd, "S", Color.RED, yes);
#--- Bar Color
AssignPriceColor(if !ColorBars then Color.CURRENT else
if macdSel then
if bc>0 then CreateColor(1, 185, 7) else
if bc<0 then CreateColor(224, 4, 4) else Color.YELLOW else
if hc>0 then CreateColor(1, 185, 7) else
if hc<0 then CreateColor(224, 4, 4) else Color.YELLOW);


#Define the signals

#plot BuyArrow = if (Hist crosses above SigLine) then 0 else Double.NaN;
#BuyArrow.SetPaintingStrategy(PaintingStrategy.ARROW_UP);
#BuyArrow.SetDefaultColor(Color.WHITE);
#BuyArrow.HideTitle();
#BuyArrow.HideBubble();

#plot SellArrow = if (Hist crosses below SigLine) then 0 else Double.NaN;
#SellArrow.SetPaintingStrategy(PaintingStrategy.ARROW_DOWN);
#SellArrow.SetDefaultColor(Color.WHITE);
#SellArrow.HideTitle();
#SellArrow.HideBubble();

#alert(buyarrow,alert.ONCE,sound.Chimes);
#alert(sellarrow,alert.ONCE,sound.Chimes);


#--- END of CODE
Last edited: