Problems With Repainting Indicators

hballa

Member
VIP
Hi,
I am working on scanner to get stocks based on "Long" status on daily basis, but partially successful.
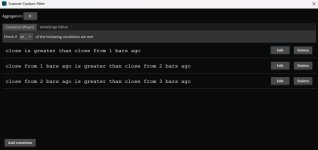
1. In screenshot "Conditions" , I am using 3 conditions
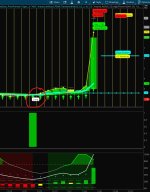
2. In screenshot "Long11_25" , Long status appeared on 11/25, but stock PRFX appeared in scan today
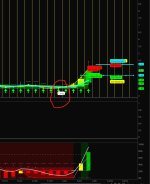
3. In screenshot "Long11_27" , Long status appeared on 11/25, but stock TARA appeared in scan today
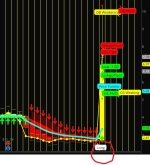
4. In screenshot "RKDA" , Long status appeared on 12/5, but stock RKDA appeared in scan today as expected.

Out of 3 stocks, RKDA worked as expected. Can you please suggest me if I am missing anything to see why I got 11/25 stocks appeared in today's scan?

Really appreciate your help.

thanks, I am using script from this forums..it's CSR script from this forum

#CSR Buy/Sell Arrows with Short/LongHaulFilter Bubbles
#Developed 4-9-22 First Edition

declare upper;

input atrreversal = 2.0;#Hint atrreversal: Turn down for more entries, up for less entries. Purple signal indicates low point reversal and close approaching Kijun. Orange signal indicates the price is crossing the Kijun. Green signal indicates the low of the candle holds over the Kijun. Red signal means reversal at a high point.
def priceh = MovingAverage(AverageType.EXPONENTIAL, high, 5);
def pricel = MovingAverage(AverageType.EXPONENTIAL, low, 5);

def EIL = ZigZagHighLow("price h" = priceh, "price l" = pricel, "percentage reversal" = .01, "absolute reversal" = .05, "atr length" = 5, "atr reversal" = atrreversal).lastL;
def EIH = ZigZagHighLow("price h" = priceh, "price l" = pricel, "percentage reversal" = .01, "absolute reversal" = .05, "atr length" = 5, "atr reversal" = atrreversal).lastH;

def tenkan_period = 9;
def kijun_period = 26;
def Kijun = (Highest(high, kijun_period) + Lowest(low, kijun_period)) / 2;
def avgPerc = ((Kijun - close) / Kijun) * 100;

plot signal = !isNaN(EIL) within 15 bars and low < Kijun and avgPerc < 15 and avgPerc > 0 and avgPerc[1] < avgPerc;
signal.setDefaultColor(color.white);

plot KijunCross = signal within 10 bars and Crosses(close, kijun, CrossingDirection.ABOVE);
kijuncross.setDefaultColor(color.white);

def overKijun = (kijunCross within 10 bars or overKijun[1] == 1) and low > kijun;
plot overKijun1 = overKijun;
overKijun1.setDefaultcolor(color.white);

plot signalrevBot = !isNaN(EIL);

AddChartBubble(Signalrevbot, low, "Long", Color.White, no);
AddLabel(!isNan(EIL), "LONG", Color.GREEN);

input usealerts = yes;
alert(usealerts and signalrevbot[1] == 1, "Long", alert.bar, sound.ring);
 

Attachments

  • Condition.jpg
    Condition.jpg
    61.9 KB · Views: 49
  • Long11_25.jpg
    Long11_25.jpg
    121 KB · Views: 46
  • Long11_27.jpg
    Long11_27.jpg
    99.2 KB · Views: 47
  • RKDA.jpg
    RKDA.jpg
    70.1 KB · Views: 47
Solution
Sadly no. You can not get any reliable results from repainting indicators.

Scripts that repaint should NOT be used for finding entry or in Scans, Labels, Watchlists, Alerts, Conditional Orders or Backtesting Strategies.
a. It will falsely show up in your Scans, Labels, Watchlists, Alerts, Conditional Orders or Backtesting Strategies, but the signal will not be painted on your chart. You will think the script is broken.
b. Or the opposite. It will be painted on your chart but NOT show up in your Scans, Labels, Watchlists, Alerts, Conditional Orders or Backtesting Strategies. This is because it wasn't there in real time! It was painted on afterward.
You will think the script is broken.

read more...
I have a code that works overall really well. However there are times the code will repaint and give fake signals causing loosing trades. Is there a way to fix this in the code. Need some help. I can share the code is anyone is willing to help.
 

Join useThinkScript to post your question to a community of 21,000+ developers and traders.

Last edited by a moderator:
Hi Technical team,

Not sure if I should ask the question here...
I am looking for the Trend Reversal Up Arrow (where the Reversal label price) to get back in appears on the chart ... I have the Down Reversal label with price version but the UpArrow doesn't seem to work... can someone share this please. Thank you

S

This is the script I have that works the DownReversal:

Code:
# Scanner by [URL]https://usethinkscript.com/u/theelderwand[/URL]
# Discuss [URL]https://usethinkscript.com/d/183-trend-reversal-indicator-with-signals-for-thinkorswim[/URL]

def price = close;
def superfast_length = 9;
def fast_length = 14;
def slow_length = 21;
def displace = 0;

def mov_avg9 = ExpAverage(price[-displace], superfast_length);
def mov_avg14 = ExpAverage(price[-displace], fast_length);
def mov_avg21 = ExpAverage(price[-displace], slow_length);

#moving averages
def Superfast = mov_avg9;
def Fast = mov_avg14;
def Slow = mov_avg21;

def buy = mov_avg9 > mov_avg14 and mov_avg14 > mov_avg21 and low > mov_avg9;
def stopbuy = mov_avg9 <= mov_avg14;
def buynow = !buy[1] and buy;
def buysignal = CompoundValue(1, if buynow and !stopbuy then 1 else if buysignal[1] == 1 and stopbuy then 0 else buysignal[1], 0);

def Buy_Signal = buysignal[1] == 0 and buysignal == 1;
def Momentum_Down = buysignal[1] == 1 and buysignal == 0;

def sell = mov_avg9 < mov_avg14 and mov_avg14 < mov_avg21 and high < mov_avg9;
def stopsell = mov_avg9 >= mov_avg14;
def sellnow = !sell[1] and sell;
def sellsignal = CompoundValue(1, if sellnow and !stopsell then 1 else if sellsignal[1] == 1 and stopsell then 0 else sellsignal[1], 0);
def Sell_Signal = sellsignal[1] == 0 and sellsignal;


input method = {default average, high_low};
def bubbleoffset = .0005;
def percentamount = .01;
def revAmount = .05;
def atrreversal = 2.0;
def atrlength = 5;
def pricehigh = high;
def pricelow = low;
def averagelength = 5;
def averagetype = AverageType.EXPONENTIAL;
def mah = MovingAverage(averagetype, pricehigh, averagelength);
def mal = MovingAverage(averagetype, pricelow, averagelength);
def priceh = if method == method.high_low then pricehigh else mah;
def pricel = if method == method.high_low then pricelow else mal;
def EI = ZigZagHighLow("price h" = priceh, "price l" = pricel, "percentage reversal" = percentamount, "absolute reversal" = revAmount, "atr length" = atrlength, "atr reversal" = atrreversal);
rec EISave = if !IsNaN(EI) then EI else GetValue(EISave, 1);
def chg = (if EISave == priceh then priceh else pricel) - GetValue(EISave, 1);
def isUp = chg >= 0;
def EIL = if !IsNaN(EI) and !isUp then pricel else GetValue(EIL, 1);
def EIH = if !IsNaN(EI) and isUp then priceh else GetValue(EIH, 1);
def dir = CompoundValue(1, if EIL != EIL[1] or pricel == EIL[1] and pricel == EISave then 1 else if EIH != EIH[1] or priceh == EIH[1] and priceh == EISave then -1 else dir[1], 0);
def signal = CompoundValue(1, if dir > 0 and pricel > EIL then if signal[1] <= 0 then 1 else signal[1] else if dir < 0 and priceh < EIH then if signal[1] >= 0 then -1 else signal[1] else signal[1], 0);

def bullish2 = signal > 0 and signal[1] <= 0;
plot upArrow = bullish2;
upArrow.SetPaintingStrategy(PaintingStrategy.BOOLEAN_ARROW_UP);
upArrow.SetDefaultColor(CreateColor(145, 210, 144));

def bearish2 = signal < 0 and signal[1] >= 0;
plot downArrow = bearish2;
downArrow.SetPaintingStrategy(PaintingStrategy.BOOLEAN_ARROW_DOWN);
downArrow.SetDefaultColor(CreateColor(255, 15, 10));

I also found this scanner for
  • https://tos.mx/vlVadom - but it doesn't seem to work or I don't know the value to add... I have been using If True - 1 Bar but it doesn't work for the ReversalUPLabel
 
Hi Technical Team
I'd like to make a scan for Reversal Bullish Trend using chatGPT code that made a script but it didn't work well I'll write it down I need u to assist in changing it.
Thanks in advance

# Bullish Monthly Trend Reversal Script
# Criteria:
# 1. Price above moving averages (50 and 200).
# 2. RSI is oversold (below 30) and rising.
# 3. MACD bullish crossover.
# 4. Volume spike on reversal.

declare lower;

# Moving Averages
input shortMA = 50; # 50-period moving average
input longMA = 200; # 200-period moving average
def shortSMA = Average(close, shortMA);
def longSMA = Average(close, longMA);

# RSI Calculation
input rsiPeriod = 14;
input rsiOversold = 30;
def RSI = RSI(rsiPeriod);

# MACD Calculation
input fastLength = 12;
input slowLength = 26;
input macdLength = 9;
def MACDLine = ExpAverage(close, fastLength) - ExpAverage(close, slowLength);
def SignalLine = ExpAverage(MACDLine, macdLength);
def MACDHist = MACDLine - SignalLine;
def bullishMACD = MACDLine crosses above SignalLine;

# Volume Spike
input volumeMultiplier = 1.5;
def avgVolume = Average(volume, 20);
def volumeSpike = volume > avgVolume * volumeMultiplier;

# Monthly Trend Reversal Signal
def bullishReversal =
close > shortSMA and # Price above 50 MA
close > longSMA and # Price above 200 MA
RSI < rsiOversold and RSI > RSI[1] and # RSI rising from oversold
bullishMACD and # MACD bullish crossover
volumeSpike; # Volume spike on reversal

# Plot the Signal
plot Signal = bullishReversal;
Signal.SetPaintingStrategy(PaintingStrategy.BOOLEAN_POINTS);
Signal.SetDefaultColor(Color.CYAN);
Signal.SetLineWeight(3);

# Optional: Highlight on Chart
AssignBackgroundColor(if bullishReversal then Color.LIGHT_GREEN else Color.CURRENT);
 
Sadly no. You can not get any reliable results from repainting indicators.

Scripts that repaint should NOT be used for finding entry or in Scans, Labels, Watchlists, Alerts, Conditional Orders or Backtesting Strategies.
a. It will falsely show up in your Scans, Labels, Watchlists, Alerts, Conditional Orders or Backtesting Strategies, but the signal will not be painted on your chart. You will think the script is broken.
b. Or the opposite. It will be painted on your chart but NOT show up in your Scans, Labels, Watchlists, Alerts, Conditional Orders or Backtesting Strategies. This is because it wasn't there in real time! It was painted on afterward.
You will think the script is broken.

read more:
https://usethinkscript.com/threads/answers-to-commonly-asked-questions.6006/#post-57833

More on the correct use of repainters by @csricksdds:
https://usethinkscript.com/threads/agaig-non-repaint-verses-repaint-indicators-for-tos.20126/

@Stan615 @hballa @Cmat87 @soly888 @cnsling
 
Last edited by a moderator:
Solution

Similar threads

Not the exact question you're looking for?

Start a new thread and receive assistance from our community.

87k+ Posts
383 Online
Create Post

Similar threads

Similar threads

The Market Trading Game Changer

Join 2,500+ subscribers inside the useThinkScript VIP Membership Club
  • Exclusive indicators
  • Proven strategies & setups
  • Private Discord community
  • ‘Buy The Dip’ signal alerts
  • Exclusive members-only content
  • Add-ons and resources
  • 1 full year of unlimited support

Frequently Asked Questions

What is useThinkScript?

useThinkScript is the #1 community of stock market investors using indicators and other tools to power their trading strategies. Traders of all skill levels use our forums to learn about scripting and indicators, help each other, and discover new ways to gain an edge in the markets.

How do I get started?

We get it. Our forum can be intimidating, if not overwhelming. With thousands of topics, tens of thousands of posts, our community has created an incredibly deep knowledge base for stock traders. No one can ever exhaust every resource provided on our site.

If you are new, or just looking for guidance, here are some helpful links to get you started.

What are the benefits of VIP Membership?
VIP members get exclusive access to these proven and tested premium indicators: Buy the Dip, Advanced Market Moves 2.0, Take Profit, and Volatility Trading Range. In addition, VIP members get access to over 50 VIP-only custom indicators, add-ons, and strategies, private VIP-only forums, private Discord channel to discuss trades and strategies in real-time, customer support, trade alerts, and much more. Learn all about VIP membership here.
How can I access the premium indicators?
To access the premium indicators, which are plug and play ready, sign up for VIP membership here.
Back
Top