
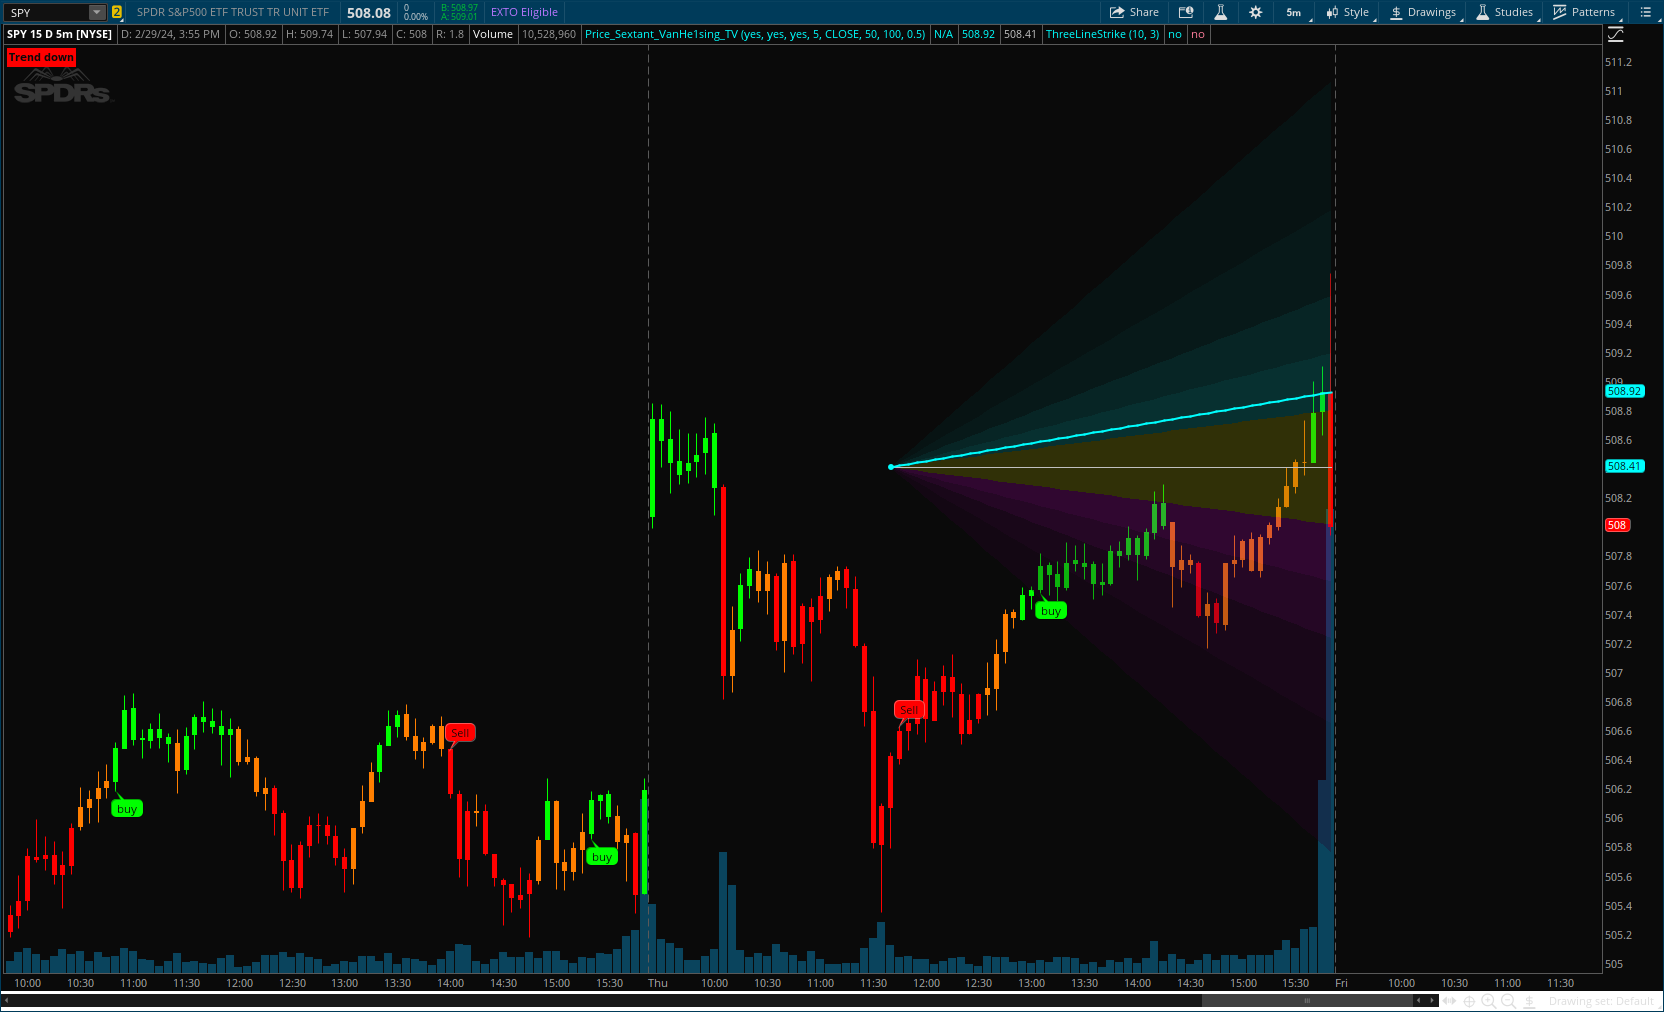
This indicator helps visualize the price position relative to its linear regression and standard deviation levels.
Read more : https://www.tradingview.com/v/nLBXT8Bi/
CODE:
CSS:
# https://www.tradingview.com/v/nLBXT8Bi/
#// This Pine Script™ code is subject to the terms of the Mozilla Public License 2.0 at https://mozill
#// © VanHe1sing
#indicator("Price Sextant", shorttitle = "PS?", max_lines_count = max_line_count, overlay = true,
# converted by Sam4Cok@Samer800    - 03/2024
# add arrow option by Sam4Cok@Samer800    - 03/2024
input colorBars  = yes;         #"Bar Color?",
input signalStyle = {Default "Bubbles", "Arrows", "Don't Show"};
input showTrendLabel = yes;
input NoOfDevLinesToShow = 5;
input source = close;
input linearRegressionLength  = 50;
input StandardDeviationLength = 100;
input StandardDeviationStep = 0.5;     # "Standard Deviation"

def na = Double.NaN;
def last = IsNaN(close);
def arrow = signalStyle==signalStyle."Arrows";
def bubble = signalStyle==signalStyle."Bubbles";
#-- Color
DefineGlobalColor("up1", CreateColor(0 ,39 ,39));
DefineGlobalColor("up2", CreateColor(0 ,59 ,59));
DefineGlobalColor("up3", CreateColor(0 ,98 ,98));
DefineGlobalColor("up4", CreateColor(0 ,137,137));
DefineGlobalColor("up5", CreateColor(0 ,177,177));
DefineGlobalColor("mid", CreateColor(137,137 ,0));
DefineGlobalColor("dn1", CreateColor(39 ,0 ,39));
DefineGlobalColor("dn2", CreateColor(59 ,0 ,59));
DefineGlobalColor("dn3", CreateColor(98 ,0 ,98));
DefineGlobalColor("dn4", CreateColor(137 ,0 ,137));
DefineGlobalColor("dn5", CreateColor(177 ,0 ,177));

Script plotLine {
input start = close;
input end = close;
input length = 50;
    def last = !isNaN(close);
    def n =  BarNumber();
    def bar = if last then n else bar[1];
    def plotCond = bar >= HighestAll(bar - length) and last;
    def slope = (end - start) / length;
    def line = start + (bar - highestAll(bar - length)) * slope;
    plot plotLine = if plotCond and line then line else Double.NaN;
}

def linreg = Inertia(source, linearRegressionLength);
def dev0 = StDev(linreg, StandardDeviationLength);
def dev1 = dev0 * StandardDeviationStep;
def dev2 = dev1 * 2.0;
def dev3 = dev2 * 1.5;
def dev4 = dev3 * 1.5;
def dev5 = dev4 * 1.5;
def src2 = if last[-1] then source else src2[1];
def src0  = HighestAll(InertiaAll(linreg, 2));
def srcP1 = if NoOfDevLinesToShow < 1 then na else HighestAll(InertiaAll(linreg + dev1, 2));
def srcP2 = if NoOfDevLinesToShow < 2 then na else HighestAll(InertiaAll(linreg + dev2, 2));
def srcP3 = if NoOfDevLinesToShow < 3 then na else HighestAll(InertiaAll(linreg + dev3, 2));
def srcP4 = if NoOfDevLinesToShow < 4 then na else HighestAll(InertiaAll(linreg + dev4, 2));
def srcP5 = if NoOfDevLinesToShow < 5 then na else HighestAll(InertiaAll(linreg + dev5, 2));
def srcN1 = if NoOfDevLinesToShow < 1 then na else HighestAll(InertiaAll(linreg - dev1, 2));
def srcN2 = if NoOfDevLinesToShow < 2 then na else HighestAll(InertiaAll(linreg - dev2, 2));
def srcN3 = if NoOfDevLinesToShow < 3 then na else HighestAll(InertiaAll(linreg - dev3, 2));
def srcN4 = if NoOfDevLinesToShow < 4 then na else HighestAll(InertiaAll(linreg - dev4, 2));
def srcN5 = if NoOfDevLinesToShow < 5 then na else HighestAll(InertiaAll(linreg - dev5, 2));

def cp1 = plotLine(src0, srcP1, linearRegressionLength);
def cp2 = plotLine(src0, srcP2, linearRegressionLength);
def cp3 = plotLine(src0, srcP3, linearRegressionLength);
def cp4 = plotLine(src0, srcP4, linearRegressionLength);
def cp5 = plotLine(src0, srcP5, linearRegressionLength);
def cn1 = plotLine(src0, srcN1, linearRegressionLength);
def cn2 = plotLine(src0, srcN2, linearRegressionLength);
def cn3 = plotLine(src0, srcN3, linearRegressionLength);
def cn4 = plotLine(src0, srcN4, linearRegressionLength);
def cn5 = plotLine(src0, srcN5, linearRegressionLength);
def cm = plotLine(src0, src0, linearRegressionLength);

def color = if src2 > cn1 and src2 < cp1 then 1 else
            if src2 > cp1 then 2 else if src2 < cn1 then -2 else -1;
def col = highestAll(inertiaAll(color, 2));

#-- plots
plot point = if cm and isNaN(cm[1]) then src0 else na;
plot trendLine = if cm and isNaN(cm[1]) then src0 else #dr;
                 if last[-1] then source else na;
plot MidLine = cm;

MidLine.SetDefaultColor(Color.LIGHT_GRAY);
trendLine.SetLineWeight(2);
trendLine.EnableApproximation();
trendLine.AssignValueColor(if col == 2 then Color.CYAN else
                           if col ==-2 then Color.MAGENTA else
                           if col == 1 then Color.YELLOW else color.GRAY);
point.SetLineWeight(3);
point.AssignValueColor(if col == 2 then Color.CYAN else
                       if col ==-2 then Color.MAGENTA else
                       if col ==1 then Color.YELLOW else color.GRAY);
point.SetPaintingStrategy(PaintingStrategy.POINTS);
#-- Cloud
AddCloud(cp5, cp4, GlobalColor("up1"), GlobalColor("up1"));
AddCloud(cp4, cp3, GlobalColor("up2"), GlobalColor("up2"));
AddCloud(cp3, cp2, GlobalColor("up3"), GlobalColor("up3"));
AddCloud(cp2, cp1, GlobalColor("up4"), GlobalColor("up4"));
AddCloud(cp1, cn1, GlobalColor("mid"), GlobalColor("mid"));
AddCloud(cn1, cn2, GlobalColor("dn4"), GlobalColor("dn4"));
AddCloud(cn2, cn3, GlobalColor("dn3"), GlobalColor("dn3"));
AddCloud(cn3, cn4, GlobalColor("dn2"), GlobalColor("dn2"));
AddCloud(cn4, cn5, GlobalColor("dn1"), GlobalColor("dn1"));

#--Bar Color
def barColor = if source > (linreg - dev1) and source < (linreg + dev1) then 1 else
               if source > (linreg + dev1) then 2 else
               if source < (linreg - dev1) then -2 else -1;
AssignPriceColor(if !colorBars then Color.CURRENT else
                 if barColor> 1 then Color.GREEN else
                 if barColor<-1 then Color.RED else
                 if barColor==1 then Color.DARK_ORANGE else Color.GRAY);
#--Signals
def cntUp = if barColor== 2 and cntUp[1]>= linearRegressionLength then 0 else cntUp[1] + 1;
def cntDn = if barColor==-2 and cntDn[1]>= linearRegressionLength then 0 else cntDn[1] + 1;

plot sigUp = if arrow and !cntUp and cntUp[1] then low else na;
plot sigDn = if arrow and !cntDn and cntDn[1] then high else na;
sigUp.SetPaintingStrategy(PaintingStrategy.ARROW_UP);
sigDn.SetPaintingStrategy(PaintingStrategy.ARROW_DOWN);
sigUp.SetDefaultColor(Color.CYAN);
sigDn.SetDefaultColor(Color.MAGENTA);

AddChartBubble(bubble and !cntUp and cntUp[1], low, "buy", Color.GREEN, no);
AddChartBubble(bubble and !cntDn and cntDn[1], high, "Sell", Color.RED, yes);

#labels
AddLabel(showTrendLabel and barColor> 1,"Trend up", Color.GREEN);
AddLabel(showTrendLabel and barColor<-1,"Trend down", Color.RED);
AddLabel(showTrendLabel and barColor==1,"Trending Range", Color.GRAY);

#-- END of CODE
Last edited:
")