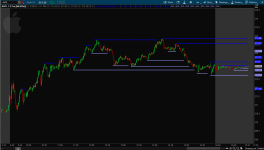
#WilliamsFractals_Plots_Limited_when_Crossed

script wf {
    input aggregationPeriod = AggregationPeriod.FIVE_MIN;
    def high15 = high(period = aggregationPeriod);
    def low15 = low(period = aggregationPeriod);
    def close15 = close(period = aggregationPeriod);
    input n = 0;
    input sequenceCount = 2;

    def maxSideLength = sequenceCount + 10;
    def upRightSide = fold i1 = 1 to maxSideLength + 1 with count1 while count1 != sequenceCount and count1 != -1 do
if GetValue( high15, -i1, -maxSideLength) > high15 or (GetValue( high15, -i1, -maxSideLength) == high15 and count1 == 0) then -1
else if GetValue( high15, -i1, -maxSideLength) < high15 then count1 + 1 else count1;
    def upLeftSide = fold i2 = 1 to maxSideLength + 1 with count2 while count2 != sequenceCount and count2 != -1 do
if GetValue( high15, i2, maxSideLength) > high15 or (GetValue(high15, i2, maxSideLength) == high15 and count2 >= 1) then -1
else if GetValue( high15, i2, maxSideLength) < high15 then count2 + 1 else count2;

    def downRightSide = fold i3 = 1 to maxSideLength + 1 with count3 while count3 != sequenceCount and count3 != -1 do
if GetValue(low15, -i3, -maxSideLength) < low15 or (GetValue(low15, -i3, -maxSideLength) == low15 and count3 == 0) then -1
else if GetValue(high15, -i3, -maxSideLength) > low15 then count3 + 1 else count3;
    def downLeftSide = fold i4 = 1 to maxSideLength + 1 with count4 while count4 != sequenceCount and count4 != -1 do
if GetValue(low15, i4, maxSideLength) < low15 or (GetValue(low15, i4, maxSideLength) == low15 and count4 >= 1) then -1
else if GetValue(low15, i4, maxSideLength) > low15 then count4 + 1 else count4;

    def bn = BarNumber();

    def UpFractal = if IsNaN(close15) then UpFractal[1] else if upRightSide == sequenceCount and upLeftSide == sequenceCount then high15 else UpFractal[1];
    def DownFractal = if IsNaN(close15) then DownFractal[1] else if downRightSide == sequenceCount and downLeftSide == sequenceCount then low15 else DownFractal[1];

#Use thisday snippet to define Each DownFractal
    def ymd1 = DownFractal;
    def ok1 = !IsNaN(close15);
    def capture1 = ok1 and ymd1 != ymd1[1];
    def dayCount1 = if capture1 then dayCount1[1] + 1 else dayCount1[1];
    def thisDay1 = (HighestAll(dayCount1) - dayCount1) ;

#Use thisday snippet to define Each UpFractal
    def ymd = UpFractal;
    def ok = !IsNaN(close15);
    def capture = ok and ymd != ymd[1];
    def dayCount = if capture then dayCount[1] + 1 else dayCount[1];
    def thisDay = (HighestAll(dayCount) - dayCount) ;


    def hh = if thisDay == n and thisDay[1] == n + 1
then high15
else Double.NaN ;
    def hhbn = if thisDay == n and thisDay[1] == n + 1
then bn
else Double.NaN ;
    def hhcross = if bn == HighestAll(hhbn)
then bn else
if bn > HighestAll(hhbn) and
!(high15[-1] crosses HighestAll(hh))
then hhcross[1] + 1
else 0 ;
    plot hhplot = if if hhcross > 0
then Between(bn, HighestAll(hhbn), HighestAll(hhcross))
else bn >= HighestAll(bn)
then HighestAll(hh)
else Double.NaN;

#Use thisday snippet to define Each DownFractal
    def ll = if thisDay1 == n and thisDay1[1] == n + 1
then low15
else Double.NaN;
    def llbn = if thisDay1 == n and thisDay1[1] == n + 1
then bn
else Double.NaN;
    def llcross = if bn == HighestAll(llbn)
then bn else
if bn > HighestAll(llbn) and
!(low15[-1] crosses HighestAll(ll))
then llcross[1] + 1
else 0 ;

    plot llplot = if if llcross > 0
then Between(bn, HighestAll(llbn), HighestAll(llcross))
else bn >= HighestAll(bn)
then HighestAll(ll)
else Double.NaN;

}
input agg = AggregationPeriod.FIVE_MIN;
input showlines = yes;
input showbubbles = yes;
input lineweight = 3;
DefineGlobalColor("U", Color.BLUE);
DefineGlobalColor("D", Color.VIOLET);

plot x0 = wf(agg, 0);
plot x1 = wf(agg, 1);
plot x2 = wf(agg, 2);
plot x3 = wf(agg, 3);
plot x4 = wf(agg, 4);
plot x5 = wf(agg, 5);
plot x6 = wf(agg, 6);
plot x7 = wf(agg, 7);
plot x8 = wf(agg, 8);
plot x9 = wf(agg, 9);

x0.SetPaintingStrategy(PaintingStrategy.HORIZONTAL);
x1.SetPaintingStrategy(PaintingStrategy.HORIZONTAL);
x2.SetPaintingStrategy(PaintingStrategy.HORIZONTAL);
x3.SetPaintingStrategy(PaintingStrategy.HORIZONTAL);
x4.SetPaintingStrategy(PaintingStrategy.HORIZONTAL);
x5.SetPaintingStrategy(PaintingStrategy.HORIZONTAL);
x6.SetPaintingStrategy(PaintingStrategy.HORIZONTAL);
x7.SetPaintingStrategy(PaintingStrategy.HORIZONTAL);
x8.SetPaintingStrategy(PaintingStrategy.HORIZONTAL);
x9.SetPaintingStrategy(PaintingStrategy.HORIZONTAL);

x0.SetLineWeight(lineweight);
x1.SetLineWeight(lineweight);
x2.SetLineWeight(lineweight);
x3.SetLineWeight(lineweight);
x4.SetLineWeight(lineweight);
x5.SetLineWeight(lineweight);
x6.SetLineWeight(lineweight);
x7.SetLineWeight(lineweight);
x8.SetLineWeight(lineweight);
x9.SetLineWeight(lineweight);

x0.SetDefaultColor(GlobalColor("U"));
x1.SetDefaultColor(GlobalColor("U"));
x2.SetDefaultColor(GlobalColor("U"));
x3.SetDefaultColor(GlobalColor("U"));
x4.SetDefaultColor(GlobalColor("U"));
x5.SetDefaultColor(GlobalColor("U"));
x6.SetDefaultColor(GlobalColor("U"));
x7.SetDefaultColor(GlobalColor("U"));
x8.SetDefaultColor(GlobalColor("U"));
x9.SetDefaultColor(GlobalColor("U"));

x0.SetHiding(!showlines);
x1.SetHiding(!showlines);
x2.SetHiding(!showlines);
x3.SetHiding(!showlines);
x4.SetHiding(!showlines);
x5.SetHiding(!showlines);
x6.SetHiding(!showlines);
x7.SetHiding(!showlines);
x8.SetHiding(!showlines);
x9.SetHiding(!showlines);

AddChartBubble(showbubbles and IsNaN(x0[1]) and x0, x0, AsText(x0), Color.LIGHT_GREEN);
AddChartBubble(showbubbles and IsNaN(x1[1]) and x1, x1, AsText(x1), Color.LIGHT_GREEN);
AddChartBubble(showbubbles and IsNaN(x2[1]) and x2, x2, AsText(x2), Color.LIGHT_GREEN);
AddChartBubble(showbubbles and IsNaN(x3[1]) and x3, x3, AsText(x3), Color.LIGHT_GREEN);
AddChartBubble(showbubbles and IsNaN(x4[1]) and x4, x4, AsText(x4), Color.LIGHT_GREEN);
AddChartBubble(showbubbles and IsNaN(x5[1]) and x5, x5, AsText(x5), Color.LIGHT_GREEN);
AddChartBubble(showbubbles and IsNaN(x6[1]) and x6, x6, AsText(x6), Color.LIGHT_GREEN);
AddChartBubble(showbubbles and IsNaN(x7[1]) and x7, x7, AsText(x7), Color.LIGHT_GREEN);
AddChartBubble(showbubbles and IsNaN(x8[1]) and x8, x8, AsText(x8), Color.LIGHT_GREEN);
AddChartBubble(showbubbles and IsNaN(x9[1]) and x9, x9, AsText(x9), Color.LIGHT_GREEN);


plot y0 = wf(agg, 0).llplot;
plot y1 = wf(agg, 1).llplot;
plot y2 = wf(agg, 2).llplot;
plot y3 = wf(agg, 3).llplot;
plot y4 = wf(agg, 4).llplot;
plot y5 = wf(agg, 5).llplot;
plot y6 = wf(agg, 6).llplot;
plot y7 = wf(agg, 7).llplot;
plot y8 = wf(agg, 8).llplot;
plot y9 = wf(agg, 9).llplot;

y0.SetPaintingStrategy(PaintingStrategy.HORIZONTAL);
y1.SetPaintingStrategy(PaintingStrategy.HORIZONTAL);
y2.SetPaintingStrategy(PaintingStrategy.HORIZONTAL);
y3.SetPaintingStrategy(PaintingStrategy.HORIZONTAL);
y4.SetPaintingStrategy(PaintingStrategy.HORIZONTAL);
y5.SetPaintingStrategy(PaintingStrategy.HORIZONTAL);
y6.SetPaintingStrategy(PaintingStrategy.HORIZONTAL);
y7.SetPaintingStrategy(PaintingStrategy.HORIZONTAL);
y8.SetPaintingStrategy(PaintingStrategy.HORIZONTAL);
y9.SetPaintingStrategy(PaintingStrategy.HORIZONTAL);

y0.SetLineWeight(lineweight);
y1.SetLineWeight(lineweight);
y2.SetLineWeight(lineweight);
y3.SetLineWeight(lineweight);
y4.SetLineWeight(lineweight);
y5.SetLineWeight(lineweight);
y6.SetLineWeight(lineweight);
y7.SetLineWeight(lineweight);
y8.SetLineWeight(lineweight);
y9.SetLineWeight(lineweight);

y0.SetDefaultColor(GlobalColor("D"));
y1.SetDefaultColor(GlobalColor("D"));
y2.SetDefaultColor(GlobalColor("D"));
y3.SetDefaultColor(GlobalColor("D"));
y4.SetDefaultColor(GlobalColor("D"));
y5.SetDefaultColor(GlobalColor("D"));
y6.SetDefaultColor(GlobalColor("D"));
y7.SetDefaultColor(GlobalColor("D"));
y8.SetDefaultColor(GlobalColor("D"));
y9.SetDefaultColor(GlobalColor("D"));

y0.SetHiding(!showlines);
y1.SetHiding(!showlines);
y2.SetHiding(!showlines);
y3.SetHiding(!showlines);
y4.SetHiding(!showlines);
y5.SetHiding(!showlines);
y6.SetHiding(!showlines);
y7.SetHiding(!showlines);
y8.SetHiding(!showlines);
y9.SetHiding(!showlines);

AddChartBubble(showbubbles and IsNaN(y0[1]) and y0, y0, AsText(y0), Color.LIGHT_RED, no);
AddChartBubble(showbubbles and IsNaN(y1[1]) and y1, y1, AsText(y1), Color.LIGHT_RED, no);
AddChartBubble(showbubbles and IsNaN(y2[1]) and y2, y2, AsText(y2), Color.LIGHT_RED, no);
AddChartBubble(showbubbles and IsNaN(y3[1]) and y3, y3, AsText(y3), Color.LIGHT_RED, no);
AddChartBubble(showbubbles and IsNaN(y4[1]) and y4, y4, AsText(y4), Color.LIGHT_RED, no);
AddChartBubble(showbubbles and IsNaN(y5[1]) and y5, y5, AsText(y5), Color.LIGHT_RED, no);
AddChartBubble(showbubbles and IsNaN(y6[1]) and y6, y6, AsText(y6), Color.LIGHT_RED, no);
AddChartBubble(showbubbles and IsNaN(y7[1]) and y7, y7, AsText(y7), Color.LIGHT_RED, no);
AddChartBubble(showbubbles and IsNaN(y8[1]) and y8, y8, AsText(y8), Color.LIGHT_RED, no);
AddChartBubble(showbubbles and IsNaN(y9[1]) and y9, y9, AsText(y9), Color.LIGHT_RED, no);
#

