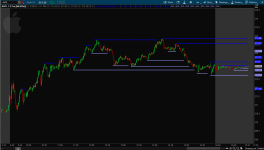
Price crossing Fractals script needed

vladislavpv

New member
General idea.
I need a study which indicates when price is approaching the Williams Fractals


Definitions:
https://tlc.thinkorswim.com/center/...s-library/bearish-and-bullish/WilliamsFractal


Sequence count should be a variable parameter.

The script details:
Script calculates the latest fractals on the corresponding time-frame and takes into account only those 10 (ten!) of them, which have not been crossed by the price yet.
Signal should appear only ONCE per every fractal.
 
Solution
what should n be? i am not getting it
plot x0 = aggregationPeriod.wf(0);?
I change like above but its giving wrong lines like zigzag

When you added the input aggregationPeriod = AggregationPeriod.FIVE_MIN; to wf{} script, it added a parameter that needed to be included in the plot statements.

So I added the another input agg = aggregationPeriod.FIVE_MIN; outside the script to fix the plots.

Since your input aggregationperiod became the 1st circled parameter, then the added input agg is the used in the plot x0 = wf(agg,0); to make the plots MTF as you wished. The n parameter was already changed for each plot. The sequence count was not changed from the script, so it was not necessary in...
General idea.
I need a study which indicates when price is approaching the Williams Fractals


Definitions:
https://tlc.thinkorswim.com/center/...s-library/bearish-and-bullish/WilliamsFractal


Sequence count should be a variable parameter.

The script details:
Script calculates the latest fractals on the corresponding time-frame and takes into account only those 10 (ten!) of them, which have not been crossed by the price yet.
Signal should appear only ONCE per every fractal.

Here are the plots of the last 10 up/down fractals limited if the fractals are crossed. If you want to use more fractals, then use the script logic as shown in the code below

Capture.jpg
Ruby:
#WilliamsFractals_Plots_Limited_when_Crossed

script wf {
    input n = 0;
    input sequenceCount = 2;

    def maxSideLength = sequenceCount + 10;
    def upRightSide = fold i1 = 1 to maxSideLength + 1 with count1 while count1 != sequenceCount and count1 != -1 do
    if GetValue(high, -i1, -maxSideLength) > high or (GetValue(high, -i1, -maxSideLength) == high and count1 == 0) then -1
    else if GetValue(high, -i1, -maxSideLength) < high then count1 + 1 else count1;
    def upLeftSide = fold i2 = 1 to maxSideLength + 1 with count2 while count2 != sequenceCount and count2 != -1 do
    if GetValue(high, i2, maxSideLength) > high or (GetValue(high, i2, maxSideLength) == high and count2 >= 1) then -1
    else if GetValue(high, i2, maxSideLength) < high then count2 + 1 else count2;

    def downRightSide = fold i3 = 1 to maxSideLength + 1 with count3 while count3 != sequenceCount and count3 != -1 do
    if GetValue(low, -i3, -maxSideLength) < low or (GetValue(low, -i3, -maxSideLength) == low and count3 == 0) then -1
    else if GetValue(high, -i3, -maxSideLength) > low then count3 + 1 else count3;
    def downLeftSide = fold i4 = 1 to maxSideLength + 1 with count4 while count4 != sequenceCount and count4 != -1 do
    if GetValue(low, i4, maxSideLength) < low or (GetValue(low, i4, maxSideLength) == low and count4 >= 1) then -1
    else if GetValue(low, i4, maxSideLength) > low then count4 + 1 else count4;

    def bn = BarNumber();

    def UpFractal = if IsNaN(close) then UpFractal[1] else if upRightSide == sequenceCount and upLeftSide == sequenceCount then high else UpFractal[1];
    def DownFractal = if IsNaN(close) then downFractal[1] else if downRightSide == sequenceCount and downLeftSide == sequenceCount then low else downfractal[1];

#Use thisday snippet to define Each DownFractal
    def ymd1 = DownFractal;
    def ok1 = !IsNaN(close);
    def capture1 = ok1 and ymd1 != ymd1[1];
    def dayCount1 = if capture1 then dayCount1[1] + 1 else dayCount1[1];
    def thisDay1 = (HighestAll(dayCount1) - dayCount1) ;

#Use thisday snippet to define Each UpFractal
    def ymd = UpFractal;
    def ok = !IsNaN(close);
    def capture = ok and ymd != ymd[1];
    def dayCount = if capture then dayCount[1] + 1 else dayCount[1];
    def thisDay = (HighestAll(dayCount) - dayCount) ;


    def hh = if thisDay == n and thisDay[1] == n + 1
                              then high
                              else double.nan ;
    def hhbn = if thisDay == n and thisDay[1] == n + 1
                              then bn
                              else double.nan ;
    def hhcross = if bn == HighestAll(hhbn)
                   then bn  else
                  if bn > HighestAll(hhbn) and
                     !(high[-1] crosses HighestAll(hh))
                   then hhcross[1] + 1
                  else 0 ;
    plot hhplot = if if hhcross > 0
                      then Between(bn, HighestAll(hhbn), HighestAll(hhcross))
                     else bn >= HighestAll(bn)
                   then HighestAll(hh)
                  else Double.NaN;

#Use thisday snippet to define Each DownFractal
    def ll = if thisDay1 == n and thisDay1[1] == n + 1
                              then low
                              else double.nan;
    def llbn = if thisDay1 == n and thisDay1[1] == n + 1
                              then bn
                              else double.nan;
    def llcross = if bn == HighestAll(llbn)
                   then bn  else
                  if bn > HighestAll(llbn) and
                     !(low[-1] crosses HighestAll(ll))
                   then llcross[1] + 1
                  else 0 ;

    plot llplot = if if llcross > 0
                      then Between(bn, HighestAll(llbn), HighestAll(llcross))
                     else bn >= HighestAll(bn)
                   then highestAll(ll)
                  else Double.NaN;

}
input lineweight = 3;
DefineGlobalColor("U", Color.GREEN);
DefineGlobalColor("D", Color.red);

plot x0 = wf(0);
plot x1 = wf(1);
plot x2  = wf(2);
plot x3  = wf(3);
plot x4  = wf(4);
plot x5  = wf(5);
plot x6  = wf(6);
plot x7  = wf(7);
plot x8  = wf(8);
plot x9  = wf(9);

x0.SetPaintingStrategy(PaintingStrategy.HORIZONTAL);
x1.SetPaintingStrategy(PaintingStrategy.HORIZONTAL);
x2.SetPaintingStrategy(PaintingStrategy.HORIZONTAL);
x3.SetPaintingStrategy(PaintingStrategy.HORIZONTAL);
x4.SetPaintingStrategy(PaintingStrategy.HORIZONTAL);
x5.SetPaintingStrategy(PaintingStrategy.HORIZONTAL);
x6.SetPaintingStrategy(PaintingStrategy.HORIZONTAL);
x7.SetPaintingStrategy(PaintingStrategy.HORIZONTAL);
x8.SetPaintingStrategy(PaintingStrategy.HORIZONTAL);
x9.SetPaintingStrategy(PaintingStrategy.HORIZONTAL);

x0.SetLineWeight(lineweight);
x1.SetLineWeight(lineweight);
x2.SetLineWeight(lineweight);
x3.SetLineWeight(lineweight);
x4.SetLineWeight(lineweight);
x5.SetLineWeight(lineweight);
x6.SetLineWeight(lineweight);
x7.SetLineWeight(lineweight);
x8.SetLineWeight(lineweight);
x9.SetLineWeight(lineweight);

x0.SetDefaultColor(GlobalColor("U"));
x1.SetDefaultColor(GlobalColor("U"));
x2.SetDefaultColor(GlobalColor("U"));
x3.SetDefaultColor(GlobalColor("U"));
x4.SetDefaultColor(GlobalColor("U"));
x5.SetDefaultColor(GlobalColor("U"));
x6.SetDefaultColor(GlobalColor("U"));
x7.SetDefaultColor(GlobalColor("U"));
x8.SetDefaultColor(GlobalColor("U"));
x9.SetDefaultColor(GlobalColor("U"));

plot y0 = wf(0).llplot;
plot y1 = wf(1).llplot;
plot y2 = wf(2).llplot;
plot y3 = wf(3).llplot;
plot y4 = wf(4).llplot;
plot y5 = wf(5).llplot;
plot y6 = wf(6).llplot;
plot y7 = wf(7).llplot;
plot y8 = wf(8).llplot;
plot y9 = wf(9).llplot;

y0.SetPaintingStrategy(PaintingStrategy.HORIZONTAL);
y1.SetPaintingStrategy(PaintingStrategy.HORIZONTAL);
y2.SetPaintingStrategy(PaintingStrategy.HORIZONTAL);
y3.SetPaintingStrategy(PaintingStrategy.HORIZONTAL);
y4.SetPaintingStrategy(PaintingStrategy.HORIZONTAL);
y5.SetPaintingStrategy(PaintingStrategy.HORIZONTAL);
y6.SetPaintingStrategy(PaintingStrategy.HORIZONTAL);
y7.SetPaintingStrategy(PaintingStrategy.HORIZONTAL);
y8.SetPaintingStrategy(PaintingStrategy.HORIZONTAL);
y9.SetPaintingStrategy(PaintingStrategy.HORIZONTAL);

y0.SetLineWeight(lineweight);
y1.SetLineWeight(lineweight);
y2.SetLineWeight(lineweight);
y3.SetLineWeight(lineweight);
y4.SetLineWeight(lineweight);
y5.SetLineWeight(lineweight);
y6.SetLineWeight(lineweight);
y7.SetLineWeight(lineweight);
y8.SetLineWeight(lineweight);
y9.SetLineWeight(lineweight);

y0.SetDefaultColor(GlobalColor("D"));
y1.SetDefaultColor(GlobalColor("D"));
y2.SetDefaultColor(GlobalColor("D"));
y3.SetDefaultColor(GlobalColor("D"));
y4.SetDefaultColor(GlobalColor("D"));
y5.SetDefaultColor(GlobalColor("D"));
y6.SetDefaultColor(GlobalColor("D"));
y7.SetDefaultColor(GlobalColor("D"));
y8.SetDefaultColor(GlobalColor("D"));
y9.SetDefaultColor(GlobalColor("D"));
#
 

Join useThinkScript to post your question to a community of 21,000+ developers and traders.

what should n be? i am not getting it
plot x0 = aggregationPeriod.wf(0);?
I change like above but its giving wrong lines like zigzag

When you added the input aggregationPeriod = AggregationPeriod.FIVE_MIN; to wf{} script, it added a parameter that needed to be included in the plot statements.

So I added the another input agg = aggregationPeriod.FIVE_MIN; outside the script to fix the plots.

Since your input aggregationperiod became the 1st circled parameter, then the added input agg is the used in the plot x0 = wf(agg,0); to make the plots MTF as you wished. The n parameter was already changed for each plot. The sequence count was not changed from the script, so it was not necessary in the plot statements.


Full Code
Screenshot 2024-06-26 141219.png
Code:
#WilliamsFractals_Plots_Limited_when_Crossed

script wf {
input aggregationPeriod = AggregationPeriod.FIVE_MIN;
def high15 = high(period = aggregationPeriod);
def low15 = low(period = aggregationPeriod);
def close15 = close(period = aggregationPeriod);
input n = 0;
input sequenceCount = 2;

def maxSideLength = sequenceCount + 10;
def upRightSide = fold i1 = 1 to maxSideLength + 1 with count1 while count1 != sequenceCount and count1 != -1 do
if GetValue( high15, -i1, -maxSideLength) > high15 or (GetValue( high15, -i1, -maxSideLength) == high15 and count1 == 0) then -1
else if GetValue( high15, -i1, -maxSideLength) < high15 then count1 + 1 else count1;
def upLeftSide = fold i2 = 1 to maxSideLength + 1 with count2 while count2 != sequenceCount and count2 != -1 do
if GetValue( high15, i2, maxSideLength) > high15 or (GetValue(high15, i2, maxSideLength) == high15 and count2 >= 1) then -1
else if GetValue( high15, i2, maxSideLength) < high15 then count2 + 1 else count2;

def downRightSide = fold i3 = 1 to maxSideLength + 1 with count3 while count3 != sequenceCount and count3 != -1 do
if GetValue(low15, -i3, -maxSideLength) < low15 or (GetValue(low15, -i3, -maxSideLength) == low15 and count3 == 0) then -1
else if GetValue(high15, -i3, -maxSideLength) > low15 then count3 + 1 else count3;
def downLeftSide = fold i4 = 1 to maxSideLength + 1 with count4 while count4 != sequenceCount and count4 != -1 do
if GetValue(low15, i4, maxSideLength) < low15 or (GetValue(low15, i4, maxSideLength) == low15 and count4 >= 1) then -1
else if GetValue(low15, i4, maxSideLength) > low15 then count4 + 1 else count4;

def bn = BarNumber();

def UpFractal = if IsNaN(close15) then UpFractal[1] else if upRightSide == sequenceCount and upLeftSide == sequenceCount then high15 else UpFractal[1];
def DownFractal = if IsNaN(close15) then DownFractal[1] else if downRightSide == sequenceCount and downLeftSide == sequenceCount then low15 else DownFractal[1];

#Use thisday snippet to define Each DownFractal
def ymd1 = DownFractal;
def ok1 = !IsNaN(close15);
def capture1 = ok1 and ymd1 != ymd1[1];
def dayCount1 = if capture1 then dayCount1[1] + 1 else dayCount1[1];
def thisDay1 = (HighestAll(dayCount1) - dayCount1) ;

#Use thisday snippet to define Each UpFractal
def ymd = UpFractal;
def ok = !IsNaN(close15);
def capture = ok and ymd != ymd[1];
def dayCount = if capture then dayCount[1] + 1 else dayCount[1];
def thisDay = (HighestAll(dayCount) - dayCount) ;


def hh = if thisDay == n and thisDay[1] == n + 1
then high15
else Double.NaN ;
def hhbn = if thisDay == n and thisDay[1] == n + 1
then bn
else Double.NaN ;
def hhcross = if bn == HighestAll(hhbn)
then bn else
if bn > HighestAll(hhbn) and
!(high15[-1] crosses HighestAll(hh))
then hhcross[1] + 1
else 0 ;
plot hhplot = if if hhcross > 0
then Between(bn, HighestAll(hhbn), HighestAll(hhcross))
else bn >= HighestAll(bn)
then HighestAll(hh)
else Double.NaN;

#Use thisday snippet to define Each DownFractal
def ll = if thisDay1 == n and thisDay1[1] == n + 1
then low15
else Double.NaN;
def llbn = if thisDay1 == n and thisDay1[1] == n + 1
then bn
else Double.NaN;
def llcross = if bn == HighestAll(llbn)
then bn else
if bn > HighestAll(llbn) and
!(low15[-1] crosses HighestAll(ll))
then llcross[1] + 1
else 0 ;

plot llplot = if if llcross > 0
then Between(bn, HighestAll(llbn), HighestAll(llcross))
else bn >= HighestAll(bn)
then HighestAll(ll)
else Double.NaN;

}
input agg = aggregationPeriod.FIVE_MIN;
input lineweight = 3;
DefineGlobalColor("U", Color.BLUE);
DefineGlobalColor("D", Color.VIOLET);

plot x0 = wf(agg,0);
plot x1 = wf(agg,1);
plot x2 = wf(agg,2);
plot x3 = wf(agg,3);
plot x4 = wf(agg,4);
plot x5 = wf(agg,5);
plot x6 = wf(agg,6);
plot x7 = wf(agg,7);
plot x8 = wf(agg,8);
plot x9 = wf(agg,9);

x0.SetPaintingStrategy(PaintingStrategy.HORIZONTAL);
x1.SetPaintingStrategy(PaintingStrategy.HORIZONTAL);
x2.SetPaintingStrategy(PaintingStrategy.HORIZONTAL);
x3.SetPaintingStrategy(PaintingStrategy.HORIZONTAL);
x4.SetPaintingStrategy(PaintingStrategy.HORIZONTAL);
x5.SetPaintingStrategy(PaintingStrategy.HORIZONTAL);
x6.SetPaintingStrategy(PaintingStrategy.HORIZONTAL);
x7.SetPaintingStrategy(PaintingStrategy.HORIZONTAL);
x8.SetPaintingStrategy(PaintingStrategy.HORIZONTAL);
x9.SetPaintingStrategy(PaintingStrategy.HORIZONTAL);

x0.SetLineWeight(lineweight);
x1.SetLineWeight(lineweight);
x2.SetLineWeight(lineweight);
x3.SetLineWeight(lineweight);
x4.SetLineWeight(lineweight);
x5.SetLineWeight(lineweight);
x6.SetLineWeight(lineweight);
x7.SetLineWeight(lineweight);
x8.SetLineWeight(lineweight);
x9.SetLineWeight(lineweight);

x0.SetDefaultColor(GlobalColor("U"));
x1.SetDefaultColor(GlobalColor("U"));
x2.SetDefaultColor(GlobalColor("U"));
x3.SetDefaultColor(GlobalColor("U"));
x4.SetDefaultColor(GlobalColor("U"));
x5.SetDefaultColor(GlobalColor("U"));
x6.SetDefaultColor(GlobalColor("U"));
x7.SetDefaultColor(GlobalColor("U"));
x8.SetDefaultColor(GlobalColor("U"));
x9.SetDefaultColor(GlobalColor("U"));

plot y0 = wf(agg,0).llplot;
plot y1 = wf(agg,1).llplot;
plot y2 = wf(agg,2).llplot;
plot y3 = wf(agg,3).llplot;
plot y4 = wf(agg,4).llplot;
plot y5 = wf(agg,5).llplot;
plot y6 = wf(agg,6).llplot;
plot y7 = wf(agg,7).llplot;
plot y8 = wf(agg,8).llplot;
plot y9 = wf(agg,9).llplot;

y0.SetPaintingStrategy(PaintingStrategy.HORIZONTAL);
y1.SetPaintingStrategy(PaintingStrategy.HORIZONTAL);
y2.SetPaintingStrategy(PaintingStrategy.HORIZONTAL);
y3.SetPaintingStrategy(PaintingStrategy.HORIZONTAL);
y4.SetPaintingStrategy(PaintingStrategy.HORIZONTAL);
y5.SetPaintingStrategy(PaintingStrategy.HORIZONTAL);
y6.SetPaintingStrategy(PaintingStrategy.HORIZONTAL);
y7.SetPaintingStrategy(PaintingStrategy.HORIZONTAL);
y8.SetPaintingStrategy(PaintingStrategy.HORIZONTAL);
y9.SetPaintingStrategy(PaintingStrategy.HORIZONTAL);

y0.SetLineWeight(lineweight);
y1.SetLineWeight(lineweight);
y2.SetLineWeight(lineweight);
y3.SetLineWeight(lineweight);
y4.SetLineWeight(lineweight);
y5.SetLineWeight(lineweight);
y6.SetLineWeight(lineweight);
y7.SetLineWeight(lineweight);
y8.SetLineWeight(lineweight);
y9.SetLineWeight(lineweight);

y0.SetDefaultColor(GlobalColor("D"));
y1.SetDefaultColor(GlobalColor("D"));
y2.SetDefaultColor(GlobalColor("D"));
y3.SetDefaultColor(GlobalColor("D"));
y4.SetDefaultColor(GlobalColor("D"));
y5.SetDefaultColor(GlobalColor("D"));
y6.SetDefaultColor(GlobalColor("D"));
y7.SetDefaultColor(GlobalColor("D"));
y8.SetDefaultColor(GlobalColor("D"));
y9.SetDefaultColor(GlobalColor("D"));
#
 

Attachments

  • Screenshot 2024-06-26 141219.png
    Screenshot 2024-06-26 141219.png
    58.6 KB · Views: 87
Solution
When you added the input aggregationPeriod = AggregationPeriod.FIVE_MIN; to wf{} script, it added a parameter that needed to be included in the plot statements.

So I added the another input agg = aggregationPeriod.FIVE_MIN; outside the script to fix the plots.

Since your input aggregationperiod became the 1st circled parameter, then the added input agg is the used in the plot x0 = wf(agg,0); to make the plots MTF as you wished. The n parameter was already changed for each plot. The sequence count was not changed from the script, so it was not necessary in the plot statements.


Full Code
Hi SleepyZ, can you addchartbuble instead of lines? price at where the lines start?
 
When you added the input aggregationPeriod = AggregationPeriod.FIVE_MIN; to wf{} script, it added a parameter that needed to be included in the plot statements.

So I added the another input agg = aggregationPeriod.FIVE_MIN; outside the script to fix the plots.

Since your input aggregationperiod became the 1st circled parameter, then the added input agg is the used in the plot x0 = wf(agg,0); to make the plots MTF as you wished. The n parameter was already changed for each plot. The sequence count was not changed from the script, so it was not necessary in the plot statements.


Full Code
Thank you so much for the explanation. its working.
 
Hi SleepyZ, can you addchartbuble instead of lines? price at where the lines start?

Optional bubbles added to Optional Lines, both's display controlled at the input screen.

Screenshot 2024-06-27 061510.png
Code:
#WilliamsFractals_Plots_Limited_when_Crossed

script wf {
    input aggregationPeriod = AggregationPeriod.FIVE_MIN;
    def high15 = high(period = aggregationPeriod);
    def low15 = low(period = aggregationPeriod);
    def close15 = close(period = aggregationPeriod);
    input n = 0;
    input sequenceCount = 2;

    def maxSideLength = sequenceCount + 10;
    def upRightSide = fold i1 = 1 to maxSideLength + 1 with count1 while count1 != sequenceCount and count1 != -1 do
if GetValue( high15, -i1, -maxSideLength) > high15 or (GetValue( high15, -i1, -maxSideLength) == high15 and count1 == 0) then -1
else if GetValue( high15, -i1, -maxSideLength) < high15 then count1 + 1 else count1;
    def upLeftSide = fold i2 = 1 to maxSideLength + 1 with count2 while count2 != sequenceCount and count2 != -1 do
if GetValue( high15, i2, maxSideLength) > high15 or (GetValue(high15, i2, maxSideLength) == high15 and count2 >= 1) then -1
else if GetValue( high15, i2, maxSideLength) < high15 then count2 + 1 else count2;

    def downRightSide = fold i3 = 1 to maxSideLength + 1 with count3 while count3 != sequenceCount and count3 != -1 do
if GetValue(low15, -i3, -maxSideLength) < low15 or (GetValue(low15, -i3, -maxSideLength) == low15 and count3 == 0) then -1
else if GetValue(high15, -i3, -maxSideLength) > low15 then count3 + 1 else count3;
    def downLeftSide = fold i4 = 1 to maxSideLength + 1 with count4 while count4 != sequenceCount and count4 != -1 do
if GetValue(low15, i4, maxSideLength) < low15 or (GetValue(low15, i4, maxSideLength) == low15 and count4 >= 1) then -1
else if GetValue(low15, i4, maxSideLength) > low15 then count4 + 1 else count4;

    def bn = BarNumber();

    def UpFractal = if IsNaN(close15) then UpFractal[1] else if upRightSide == sequenceCount and upLeftSide == sequenceCount then high15 else UpFractal[1];
    def DownFractal = if IsNaN(close15) then DownFractal[1] else if downRightSide == sequenceCount and downLeftSide == sequenceCount then low15 else DownFractal[1];

#Use thisday snippet to define Each DownFractal
    def ymd1 = DownFractal;
    def ok1 = !IsNaN(close15);
    def capture1 = ok1 and ymd1 != ymd1[1];
    def dayCount1 = if capture1 then dayCount1[1] + 1 else dayCount1[1];
    def thisDay1 = (HighestAll(dayCount1) - dayCount1) ;

#Use thisday snippet to define Each UpFractal
    def ymd = UpFractal;
    def ok = !IsNaN(close15);
    def capture = ok and ymd != ymd[1];
    def dayCount = if capture then dayCount[1] + 1 else dayCount[1];
    def thisDay = (HighestAll(dayCount) - dayCount) ;


    def hh = if thisDay == n and thisDay[1] == n + 1
then high15
else Double.NaN ;
    def hhbn = if thisDay == n and thisDay[1] == n + 1
then bn
else Double.NaN ;
    def hhcross = if bn == HighestAll(hhbn)
then bn else
if bn > HighestAll(hhbn) and
!(high15[-1] crosses HighestAll(hh))
then hhcross[1] + 1
else 0 ;
    plot hhplot = if if hhcross > 0
then Between(bn, HighestAll(hhbn), HighestAll(hhcross))
else bn >= HighestAll(bn)
then HighestAll(hh)
else Double.NaN;

#Use thisday snippet to define Each DownFractal
    def ll = if thisDay1 == n and thisDay1[1] == n + 1
then low15
else Double.NaN;
    def llbn = if thisDay1 == n and thisDay1[1] == n + 1
then bn
else Double.NaN;
    def llcross = if bn == HighestAll(llbn)
then bn else
if bn > HighestAll(llbn) and
!(low15[-1] crosses HighestAll(ll))
then llcross[1] + 1
else 0 ;

    plot llplot = if if llcross > 0
then Between(bn, HighestAll(llbn), HighestAll(llcross))
else bn >= HighestAll(bn)
then HighestAll(ll)
else Double.NaN;

}
input agg = AggregationPeriod.FIVE_MIN;
input showlines = yes;
input showbubbles = yes;
input lineweight = 3;
DefineGlobalColor("U", Color.BLUE);
DefineGlobalColor("D", Color.VIOLET);

plot x0 = wf(agg, 0);
plot x1 = wf(agg, 1);
plot x2 = wf(agg, 2);
plot x3 = wf(agg, 3);
plot x4 = wf(agg, 4);
plot x5 = wf(agg, 5);
plot x6 = wf(agg, 6);
plot x7 = wf(agg, 7);
plot x8 = wf(agg, 8);
plot x9 = wf(agg, 9);

x0.SetPaintingStrategy(PaintingStrategy.HORIZONTAL);
x1.SetPaintingStrategy(PaintingStrategy.HORIZONTAL);
x2.SetPaintingStrategy(PaintingStrategy.HORIZONTAL);
x3.SetPaintingStrategy(PaintingStrategy.HORIZONTAL);
x4.SetPaintingStrategy(PaintingStrategy.HORIZONTAL);
x5.SetPaintingStrategy(PaintingStrategy.HORIZONTAL);
x6.SetPaintingStrategy(PaintingStrategy.HORIZONTAL);
x7.SetPaintingStrategy(PaintingStrategy.HORIZONTAL);
x8.SetPaintingStrategy(PaintingStrategy.HORIZONTAL);
x9.SetPaintingStrategy(PaintingStrategy.HORIZONTAL);

x0.SetLineWeight(lineweight);
x1.SetLineWeight(lineweight);
x2.SetLineWeight(lineweight);
x3.SetLineWeight(lineweight);
x4.SetLineWeight(lineweight);
x5.SetLineWeight(lineweight);
x6.SetLineWeight(lineweight);
x7.SetLineWeight(lineweight);
x8.SetLineWeight(lineweight);
x9.SetLineWeight(lineweight);

x0.SetDefaultColor(GlobalColor("U"));
x1.SetDefaultColor(GlobalColor("U"));
x2.SetDefaultColor(GlobalColor("U"));
x3.SetDefaultColor(GlobalColor("U"));
x4.SetDefaultColor(GlobalColor("U"));
x5.SetDefaultColor(GlobalColor("U"));
x6.SetDefaultColor(GlobalColor("U"));
x7.SetDefaultColor(GlobalColor("U"));
x8.SetDefaultColor(GlobalColor("U"));
x9.SetDefaultColor(GlobalColor("U"));

x0.SetHiding(!showlines);
x1.SetHiding(!showlines);
x2.SetHiding(!showlines);
x3.SetHiding(!showlines);
x4.SetHiding(!showlines);
x5.SetHiding(!showlines);
x6.SetHiding(!showlines);
x7.SetHiding(!showlines);
x8.SetHiding(!showlines);
x9.SetHiding(!showlines);

AddChartBubble(showbubbles and IsNaN(x0[1]) and x0, x0, AsText(x0), Color.LIGHT_GREEN);
AddChartBubble(showbubbles and IsNaN(x1[1]) and x1, x1, AsText(x1), Color.LIGHT_GREEN);
AddChartBubble(showbubbles and IsNaN(x2[1]) and x2, x2, AsText(x2), Color.LIGHT_GREEN);
AddChartBubble(showbubbles and IsNaN(x3[1]) and x3, x3, AsText(x3), Color.LIGHT_GREEN);
AddChartBubble(showbubbles and IsNaN(x4[1]) and x4, x4, AsText(x4), Color.LIGHT_GREEN);
AddChartBubble(showbubbles and IsNaN(x5[1]) and x5, x5, AsText(x5), Color.LIGHT_GREEN);
AddChartBubble(showbubbles and IsNaN(x6[1]) and x6, x6, AsText(x6), Color.LIGHT_GREEN);
AddChartBubble(showbubbles and IsNaN(x7[1]) and x7, x7, AsText(x7), Color.LIGHT_GREEN);
AddChartBubble(showbubbles and IsNaN(x8[1]) and x8, x8, AsText(x8), Color.LIGHT_GREEN);
AddChartBubble(showbubbles and IsNaN(x9[1]) and x9, x9, AsText(x9), Color.LIGHT_GREEN);


plot y0 = wf(agg, 0).llplot;
plot y1 = wf(agg, 1).llplot;
plot y2 = wf(agg, 2).llplot;
plot y3 = wf(agg, 3).llplot;
plot y4 = wf(agg, 4).llplot;
plot y5 = wf(agg, 5).llplot;
plot y6 = wf(agg, 6).llplot;
plot y7 = wf(agg, 7).llplot;
plot y8 = wf(agg, 8).llplot;
plot y9 = wf(agg, 9).llplot;

y0.SetPaintingStrategy(PaintingStrategy.HORIZONTAL);
y1.SetPaintingStrategy(PaintingStrategy.HORIZONTAL);
y2.SetPaintingStrategy(PaintingStrategy.HORIZONTAL);
y3.SetPaintingStrategy(PaintingStrategy.HORIZONTAL);
y4.SetPaintingStrategy(PaintingStrategy.HORIZONTAL);
y5.SetPaintingStrategy(PaintingStrategy.HORIZONTAL);
y6.SetPaintingStrategy(PaintingStrategy.HORIZONTAL);
y7.SetPaintingStrategy(PaintingStrategy.HORIZONTAL);
y8.SetPaintingStrategy(PaintingStrategy.HORIZONTAL);
y9.SetPaintingStrategy(PaintingStrategy.HORIZONTAL);

y0.SetLineWeight(lineweight);
y1.SetLineWeight(lineweight);
y2.SetLineWeight(lineweight);
y3.SetLineWeight(lineweight);
y4.SetLineWeight(lineweight);
y5.SetLineWeight(lineweight);
y6.SetLineWeight(lineweight);
y7.SetLineWeight(lineweight);
y8.SetLineWeight(lineweight);
y9.SetLineWeight(lineweight);

y0.SetDefaultColor(GlobalColor("D"));
y1.SetDefaultColor(GlobalColor("D"));
y2.SetDefaultColor(GlobalColor("D"));
y3.SetDefaultColor(GlobalColor("D"));
y4.SetDefaultColor(GlobalColor("D"));
y5.SetDefaultColor(GlobalColor("D"));
y6.SetDefaultColor(GlobalColor("D"));
y7.SetDefaultColor(GlobalColor("D"));
y8.SetDefaultColor(GlobalColor("D"));
y9.SetDefaultColor(GlobalColor("D"));

y0.SetHiding(!showlines);
y1.SetHiding(!showlines);
y2.SetHiding(!showlines);
y3.SetHiding(!showlines);
y4.SetHiding(!showlines);
y5.SetHiding(!showlines);
y6.SetHiding(!showlines);
y7.SetHiding(!showlines);
y8.SetHiding(!showlines);
y9.SetHiding(!showlines);

AddChartBubble(showbubbles and IsNaN(y0[1]) and y0, y0, AsText(y0), Color.LIGHT_RED, no);
AddChartBubble(showbubbles and IsNaN(y1[1]) and y1, y1, AsText(y1), Color.LIGHT_RED, no);
AddChartBubble(showbubbles and IsNaN(y2[1]) and y2, y2, AsText(y2), Color.LIGHT_RED, no);
AddChartBubble(showbubbles and IsNaN(y3[1]) and y3, y3, AsText(y3), Color.LIGHT_RED, no);
AddChartBubble(showbubbles and IsNaN(y4[1]) and y4, y4, AsText(y4), Color.LIGHT_RED, no);
AddChartBubble(showbubbles and IsNaN(y5[1]) and y5, y5, AsText(y5), Color.LIGHT_RED, no);
AddChartBubble(showbubbles and IsNaN(y6[1]) and y6, y6, AsText(y6), Color.LIGHT_RED, no);
AddChartBubble(showbubbles and IsNaN(y7[1]) and y7, y7, AsText(y7), Color.LIGHT_RED, no);
AddChartBubble(showbubbles and IsNaN(y8[1]) and y8, y8, AsText(y8), Color.LIGHT_RED, no);
AddChartBubble(showbubbles and IsNaN(y9[1]) and y9, y9, AsText(y9), Color.LIGHT_RED, no);
#
 
Last edited:
Hi SleepyZ, in the above image with Chart bubbles, I see Nan, why does it not showing the price?

Thanks for pointing that out!

There was an error when I was replicating the bubble code where

AddChartBubble(showbubbles and IsNaN(x6[1]) and x6, x6, AsText(x5), Color.LIGHT_GREEN);

should have been

AddChartBubble(showbubbles and IsNaN(x6[1]) and x6, x6, AsText(x6), Color.LIGHT_GREEN);

I have fixed that code in the above post with the image.
 
Last edited:
Thanks for pointing that out!

There was an error when I was replicating the bubble code where

AddChartBubble(showbubbles and IsNaN(x6[1]) and x6, x6, AsText(x5), Color.LIGHT_GREEN);

should have been

AddChartBubble(showbubbles and IsNaN(x6[1]) and x6, x6, AsText(x6), Color.LIGHT_GREEN);

I have fixed that code in the above post with the image.
Thanks SleepyZ !
 

Similar threads

Not the exact question you're looking for?

Start a new thread and receive assistance from our community.

87k+ Posts
359 Online
Create Post

Similar threads

Similar threads

The Market Trading Game Changer

Join 2,500+ subscribers inside the useThinkScript VIP Membership Club
  • Exclusive indicators
  • Proven strategies & setups
  • Private Discord community
  • ‘Buy The Dip’ signal alerts
  • Exclusive members-only content
  • Add-ons and resources
  • 1 full year of unlimited support

Frequently Asked Questions

What is useThinkScript?

useThinkScript is the #1 community of stock market investors using indicators and other tools to power their trading strategies. Traders of all skill levels use our forums to learn about scripting and indicators, help each other, and discover new ways to gain an edge in the markets.

How do I get started?

We get it. Our forum can be intimidating, if not overwhelming. With thousands of topics, tens of thousands of posts, our community has created an incredibly deep knowledge base for stock traders. No one can ever exhaust every resource provided on our site.

If you are new, or just looking for guidance, here are some helpful links to get you started.

What are the benefits of VIP Membership?
VIP members get exclusive access to these proven and tested premium indicators: Buy the Dip, Advanced Market Moves 2.0, Take Profit, and Volatility Trading Range. In addition, VIP members get access to over 50 VIP-only custom indicators, add-ons, and strategies, private VIP-only forums, private Discord channel to discuss trades and strategies in real-time, customer support, trade alerts, and much more. Learn all about VIP membership here.
How can I access the premium indicators?
To access the premium indicators, which are plug and play ready, sign up for VIP membership here.
Back
Top