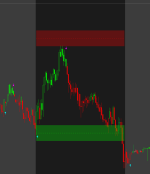
Im new to coding here but wanted to share somthing I designed and a strategy for trading using the previous days support and resistance, thank you ben for this community. I have been here for awhile but recently started to code on my own, this code will make you zones, please go to the input and type how big you want each zone to be, you can also make it so both zones are the same size using the master switch!! Please do give feedback and thank you!
Code:
declare hide_on_daily;

# Input for adjusting cloud size
input cloudSizeIncrement = 0.01; # Adjustable in 0.01 cent increments

# Validate cloud size increment
def validCloudSizeIncrement = Round(cloudSizeIncrement / 0.01, 0) * 0.01;

# Previous day's high and low
def prevDayHigh = high(period = "day")[1];
def prevDayLow = low(period = "day")[1];

# Cloud bounds for high and low
def cloudHighUpperBound = prevDayHigh + validCloudSizeIncrement / 2;
def cloudHighLowerBound = prevDayHigh - validCloudSizeIncrement / 2;
def cloudLowUpperBound = prevDayLow + validCloudSizeIncrement / 2;
def cloudLowLowerBound = prevDayLow - validCloudSizeIncrement / 2;

# Time condition (9:30 AM to 4:00 PM)
def marketOpen = 0930;
def marketClose = 1600;
def isWithinMarketHours = SecondsFromTime(marketOpen) >= 0 and SecondsTillTime(marketClose) > 0;

# Plot clouds and lines for high (red) and low (green)
AddCloud(if isWithinMarketHours then cloudHighUpperBound else Double.NaN, if isWithinMarketHours then cloudHighLowerBound else Double.NaN, Color.RED, Color.RED);
plot HighLine = if isWithinMarketHours then prevDayHigh else Double.NaN;
HighLine.SetDefaultColor(Color.RED);
HighLine.SetStyle(Curve.SHORT_DASH);
AddChartBubble(!IsNaN(close) and BarNumber() == HighestAll(BarNumber()), prevDayHigh, "Supply", Color.RED, yes);

AddCloud(if isWithinMarketHours then cloudLowUpperBound else Double.NaN, if isWithinMarketHours then cloudLowLowerBound else Double.NaN, Color.GREEN, Color.GREEN);
plot LowLine = if isWithinMarketHours then prevDayLow else Double.NaN;
LowLine.SetDefaultColor(Color.GREEN);
LowLine.SetStyle(Curve.SHORT_DASH);
AddChartBubble(!IsNaN(close) and BarNumber() == HighestAll(BarNumber()), prevDayLow, "Demand", Color.GREEN, yes);