#Example_Previous_Days_HL_for_show_x_previous_days
#

script hl {
    input method = {default TradingDays, StockTradingHours};
    input lookback = 1;

    def n   = lookback;
    def na  = Double.NaN;
    def h   = high;
    def l   = low;
    def bn  = BarNumber();
    def ymd = if TickValue() != .01 then GetYYYYMMDD() else GetDay();
    def rth = if method == method.StockTradingHours then SecondsFromTime(0930) >= 0 and SecondsFromTime(1600) < 0 else ymd;
    def capture  = !IsNaN(close) and  ymd != ymd[1];
    def dayCount = CompoundValue(1,
                   if capture and GetDayOfWeek(GetYYYYMMDD()) != 7 then dayCount[1] + 1 else dayCount[1], 0);
    def thisDay  = (HighestAll(dayCount) - (dayCount)) ;

    def hh       = if bn == 1 then 0
                   else if (thisDay == n and thisDay[1] == n + 1) and rth
                   then h
                   else if thisDay == n and rth and h > hh[1]
                   then h
                   else hh[1];
    def hhigh    = if thisDay == n and rth and h == hh then bn else na;
    def hhnan    = if IsNaN(hh) then hhnan[1] else hh;

    plot hhplot  = if BarNumber() >= HighestAll(hhigh) then (hhnan) else na;

    def ll       = if bn == 1 then 99999
                   else if thisDay == n and thisDay[1] == n + 1 and rth
                   then l
                   else if thisDay == n and rth and l < ll[1]
                   then l
                   else ll[1];
    def llow  = if thisDay == n and rth and l == ll then bn else na;
    def llnan = if IsNaN(ll) then llnan[1] else ll;

    plot llplot = if BarNumber() >= HighestAll(llow) then (llnan) else na;
}


input method = {default TradingDays, StockTradingHours};

input show_x_previous = 10;
input show_today = no;
input verticalline = yes;

def na  = Double.NaN;
def rth = SecondsFromTime(0930) >= 0 and SecondsFromTime(1600) < 0;
def ymd =  if method == method.TradingDays and TickValue() != .01 then GetYYYYMMDD() else GetDay();
AddVerticalLine(verticalline and GetDayOfWeek(GetYYYYMMDD()) != 7 and if method == method.StockTradingHours then rth != rth[1] else ymd != ymd[1], "");

plot H0 = if !show_today then na else hl(method, 0).hhplot;
plot L0 = if !show_today then na else hl(method, 0).llplot;
plot H1 = if show_x_previous < 1 then na else hl(method, 1).hhplot;
plot L1 = if show_x_previous < 1 then na else  hl(method, 1).llplot;
plot H2 = if show_x_previous < 2 then na else  hl(method, 2).hhplot;
plot L2 = if show_x_previous < 2 then na else  hl(method, 2).llplot;
plot H3 = if show_x_previous < 3 then na else  hl(method, 3).hhplot;
plot L3 = if show_x_previous < 3 then na else  hl(method, 3).llplot;
plot H4 = if show_x_previous < 4 then na else  hl(method, 4).hhplot;
plot L4 = if show_x_previous < 4 then na else  hl(method, 4).llplot;
plot H5 = if show_x_previous < 5 then na else  hl(method, 5).hhplot;
plot L5 = if show_x_previous < 5 then na else  hl(method, 5).llplot;
plot H6 = if show_x_previous < 6 then na else  hl(method, 6).hhplot;
plot L6 = if show_x_previous < 6 then na else  hl(method, 6).llplot;
plot H7 = if show_x_previous < 7 then na else  hl(method, 7).hhplot;
plot L7 = if show_x_previous < 7 then na else  hl(method, 7).llplot;
plot H8 = if show_x_previous < 8 then na else  hl(method, 8).hhplot;
plot L8 = if show_x_previous < 8 then na else  hl(method, 8).llplot;
plot H9 = if show_x_previous < 9 then na else  hl(method, 9).hhplot;
plot L9 = if show_x_previous < 9 then na else  hl(method, (9)).llplot;
plot H10 = if show_x_previous < 10 then na else hl(method, 10).hhplot;
plot L10 = if show_x_previous < 10 then na else  hl(method, 10).llplot;

DefineGlobalColor("H", Color.GREEN);
DefineGlobalColor("L", Color.RED);
H0.SetDefaultColor(GlobalColor("H"));
L0.SetDefaultColor(GlobalColor("L"));
H1.SetDefaultColor(GlobalColor("H"));
L1.SetDefaultColor(GlobalColor("L"));
H2.SetDefaultColor(GlobalColor("H"));
L2.SetDefaultColor(GlobalColor("L"));
H3.SetDefaultColor(GlobalColor("H"));
L3.SetDefaultColor(GlobalColor("L"));
H4.SetDefaultColor(GlobalColor("H"));
L4.SetDefaultColor(GlobalColor("L"));
H5.SetDefaultColor(GlobalColor("H"));
L5.SetDefaultColor(GlobalColor("L"));
H6.SetDefaultColor(GlobalColor("H"));
L6.SetDefaultColor(GlobalColor("L"));
H7.SetDefaultColor(GlobalColor("H"));
L7.SetDefaultColor(GlobalColor("L"));
H8.SetDefaultColor(GlobalColor("H"));
L8.SetDefaultColor(GlobalColor("L"));
H9.SetDefaultColor(GlobalColor("H"));
L9.SetDefaultColor(GlobalColor("L"));
H10.SetDefaultColor(GlobalColor("H"));
L10.SetDefaultColor(GlobalColor("L"));

input showbubbles = yes;
input bubblemover = 3;
def   bn    = BarNumber();
def   mover = showbubbles and bn == HighestAll(bn - bubblemover);
AddChartBubble(mover , H0, "H0", H0.TakeValueColor());
AddChartBubble(mover , H1, "H1", H1.TakeValueColor());
AddChartBubble(mover , H2, "H2", H2.TakeValueColor());
AddChartBubble(mover , H3, "H3", H3.TakeValueColor());
AddChartBubble(mover , H4, "H4", H4.TakeValueColor());
AddChartBubble(mover , H5, "H5", H5.TakeValueColor());
AddChartBubble(mover , H6, "H6", H6.TakeValueColor());
AddChartBubble(mover , H7, "H7", H7.TakeValueColor());
AddChartBubble(mover , H8, "H8", H8.TakeValueColor());
AddChartBubble(mover , H9, "H9", H9.TakeValueColor());
AddChartBubble(mover , H10, "H10", H10.TakeValueColor());

AddChartBubble(mover , L0, "L0", L0.TakeValueColor());
AddChartBubble(mover , L1, "L1", L1.TakeValueColor());
AddChartBubble(mover , L2, "L2", L2.TakeValueColor());
AddChartBubble(mover , L3, "L3", L3.TakeValueColor());
AddChartBubble(mover , L4, "L4", L4.TakeValueColor());
AddChartBubble(mover , L5, "L5", L5.TakeValueColor());
AddChartBubble(mover , L6, "L6", L6.TakeValueColor());
AddChartBubble(mover , L7, "L7", L7.TakeValueColor());
AddChartBubble(mover , L8, "L8", L8.TakeValueColor());
AddChartBubble(mover , L9, "L9", L9.TakeValueColor());
AddChartBubble(mover , L10, "L10", L10.TakeValueColor());

#

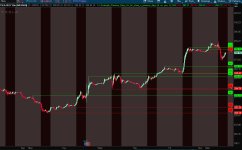
 shows the previous day's premarket high and low instead of the previous day's regular trading hours high/low.