
No, once the candles close the arrows shouldn't repaint.Thanks, but do these arrows reprint at all??
You are using an out of date browser. It may not display this or other websites correctly.
You should upgrade or use an alternative browser.
You should upgrade or use an alternative browser.
Repaints Potential Breakout Arrow Plots Indicator for ThinkorSwim
- Thread starter YungTraderFromMontana
- Start date
Repaints
Hi I am having trouble loading the scanner for this indicator? Can you post a TOS link to the scanner? I am not to familiar with coding scanners.I've made an updated version. Improvements include, accuracy, sell signals, and a scan.
It now has some more instructions so listen up:
Tip 1: Personally I'll only be using the big arrow signals as well as the sell put signal. The shared link will exclude the plot "combostrong" which is still usable but slighlty less accurate.
Instruction 1: The neon blue size 1 up arrows are the new "sellput" plot. The amazing thing about this plot is that it is calculated one day ahead so arrows will be plotted ahead of the current candle that created the signal. I use a scan that I will post in the last hour of trading to find stocks to sell weekly or biweekly otm puts on. Do not use this arrow unless you are familiar with how selling options works, if you make a mistake it could put you in a bad spot. The reasoning behind the signal is that it forecasts candles where there is an extremely small chance they will gap down, often times actually they will make you tons on a volatility crush as well as a gap up. Sell your position before the close of the candle with the signal or about a day after buying it.
Instruction 2: The red and green arrows are simple, up arrow means up, down arrow means down. Use them as you wish, personally I think they are perfect for weekly options or stock trades. These can be scaned for before the candle closes for maximum gains, only use the scan in the last 30 minutes or so of trading to ensure that arrows don't switch up on you. Looking at SPY this would virtually never happen.
Instruction 3: The purple and orange arrows are also very simple, they simply just use some different metrics and therefore catch moves where the other arrows don't. They are well used in a similar fashion to the red and green arrows. These can be scaned for before the candle closes for maximum gains, only use the scan in the last 30 minutes or so of trading to ensure that arrows don't switch up on you. Looking at SPY this would virtually never happen.
Essential Instruction 4: From studying the arrows I can say that you should never do these things.
Never trade on a Purple down arrow if a sellput signal is given for the next day (remember sellplot plots one day ahead)
Never trade on a sellput signal if there is a down arrow on the previous day.
To simplify it in terms of superiority of signals
red arrow > sellput and purple arrow < sellput.
Instruction 5: Become a rich as mofo
Link:
https://tos.mx/Khie61d
Scans (To scan for a specific arrow make sure only that code is a plot)
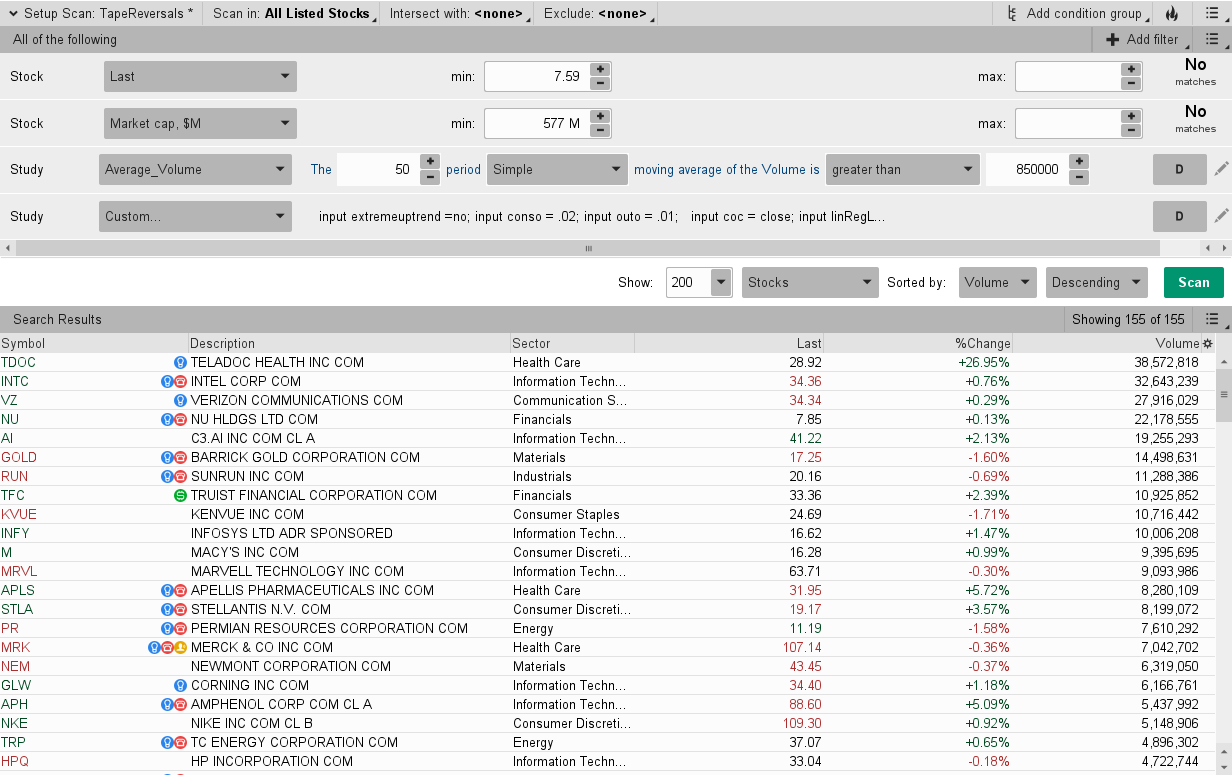
After using the scan, look at the stock and make sure the high/low isn't far from the current price. Make sure there isn't a huge wick.Code:input extremeuptrend =no; input conso = .02; input outo = .01; input coc = close; input linRegLength = 21; input smLength = 3; input displace2 = 0; input Num_Dev_Dn = -2.0; input Num_Dev_Up = 2.0; def value = Average(Inertia(coc[-displace2], linRegLength), smLength); def error = Average(sterr(coc[-displace2], linRegLength), smLength); def MiddleLine = value; def LowerBand = value + Num_Dev_Dn * error; def UpperBand = value + Num_Dev_Up * error; def total = if close < open then (high + 2 * low + close) / 2 else if close > open then (2 * high + low + close) / 2 else (high + low + 2 * close) / 2; def UpperPr = total[1] - low[1]; def LowerPr = total[1] - high[1]; def ROClength = 10; def lengthm = 10; assert(ROCLength > 0, "'roc length' must be positive: " + ROCLength); def diff = high - low; def avg = Average(diff, lengthm); def CV = if avg[roclength] == 0 then 100 else (avg - avg[roclength]) / avg[roclength] * 100; def negLine = -25; # End Code RSI_Laguerre Self Adjusting with Fractal Energy def price = close; def length4 = 10; def displace = 0; def AvgExp = ExpAverage(price[-displace], length4); def length6 = 48.5; def AvgExp2 = ExpAverage(price[-displace], length6); def c = close; def length2 = 30; def calclength2 = 5; def smoothlength2 = 3; input agg = AggregationPeriod.DAY; def zeroline = 0; def o10 = open(period = agg); def c10 = close(period = agg); def data = fold i = 0 to length2 with s do s + (if c10 > GetValue(o10, i) then 1 else if c10 < GetValue(o10, i) then - 1 else 0); def EMA5 = ExpAverage(data, calclength2); def Main = ExpAverage(EMA5, smoothLength2); def Signal = ExpAverage(Main, smoothLength2); def zero = if IsNaN(c) then Double.NaN else 0; def ob = if IsNaN(c) then Double.NaN else Round(length2 * .7); def ob2 = if IsNaN(c) then Double.NaN else Round(length2* .3); def ob3 = if IsNaN(c10) then Double.NaN else Round(length2 * .7); def os = if IsNaN(c) then Double.NaN else -Round(length2 * .2); input BuyorSell = {default Buy, Sell}; input ShowTodayOnly = yes; input ShowEntryExitBands = yes; input ShowBubbles = yes; input BuyEntry = 3; input SellEntry = 3; input BuyExit = 20; input SellExit = 20; input ATRLength = 50; input TargetATRMult = 1; input DisplayLines = yes; input PriceDigit = 2; def today = !ShowTodayOnly or GetDay() == GetLastDay() and SecondsFromTime(0930) >= 0; # High def H1 = Highest(high, SellExit); def H2 = fold i3 = 1 to SellExit with ip = 0.0 do if GetValue(high, i3) == H1 or GetValue(high, i3) < ip then ip else GetValue(high, i3); def H3 = fold i1 = 1 to SellExit with ip1 = 0.0 do if GetValue(high, i1) == H1 or GetValue(high, i1) == H2 or GetValue(high, i1) < ip1 then ip1 else GetValue(high, i1); def HH = (H2 + H3) / 2.0; # Low def L1 = Lowest(low, BuyExit); def L2 = fold i4 = 1 to BuyExit with ip2 = 10000000.0 do if GetValue(low, i4) == L1 or GetValue(low, i4) > ip2 then ip2 else GetValue(low, i4); def L3 = Lowest(if low == L1 or low == L2 then 1000000 else low, BuyExit); def LL = (L2 + L2) / 2.0; def QB = Highest(high, BuyEntry); def QS = Lowest(low, SellEntry); plot b = QS[1]; plot x = QB[1]; def y = LL[1]; def nottolate = ((main[7] - main) < 15); plot midline = (qs[1]+qb[1])/2; def ATRVal = ATR(length = ATRLength, averageType = AverageType.SIMPLE); def mATR = Highest(ATRVal, ATRLength); def badhammer = (((high-close) < ((close + open)/2) - low)) and (open > qb[1]); plot differencechange = ((main-signal) < 1) and ((main - signal) > -1) and (main < ob3); plot comboupstrongstrongstrong = (high > qb[1]) and (c[1] < qb[2]) and (((high - qb[1])/100) < outo) and (((qb[1] - Avgexp)/100) < conso) and (low < midline[1]); plot comboupstrongstrong = (high > qb[1]) and (c[1] < qb[2]) and (((open - qb[1])/100) < outo) and (((qb[1] - Avgexp)/100) < conso) and (open[1] or open[2] or open[3] < midline) and comboupstrongstrongstrong is false and (open < qb[1]) and (open[1] > Qs[2]) and (close[1] < midline[2]); plot comboupstrong = (high > qb[1]) and (close[1] < qb[2]) and (((open - qb[1])/100) < outo) and (((qb[1] - Avgexp)/100) < conso) and comboupstrongstrongstrong is false and comboupstrongstrong is false and (high > open) and (low < middleline) and (high > open); plot midcrossgapup = (((open < midline) and ((high > midline)) or ((close[1] < midline[2])) and (high > midline[1]))) and (high > open) and (differencechange) and (close[1] < qb[2]) and (high > upperpr); plot combodown = (qs[1] > qs[2]) and (low < qs[1]) and (c[1] > qs[2]) and (((qs[1] - open)/100) < outo) and (((Avgexp - qs[1])/100) < conso); plot midcrossgapdown = (((open > midline) and ((low < midline)) or ((low[1] > midline[2])) and (open < midline[1]))) and (low < open) and (close[1] > qs[2]) and (low < lowerpr); plot sellputs = (lowerpr < QS);
More improvements to come!
This MTF scan will never work because secondary aggregations cannot be used in the scan hacker.Hi I am having trouble loading the scanner for this indicator? Can you post a TOS link to the scanner? I am not to familiar with coding scanners.
The MTF portion has been removed from the script which means this scan won't match your charts.
Even with that, this scan has EIGHT different scan statements. But scans can only have one.
SEVEN of the plot statements have been commented out.
You did not indicate which of the eight conditions you were attempting to scan for; so one was chosen at random. Feel free to change to one of the other seven.
shared scan link: http://tos.mx/LZUG8yi Click here for --> Easiest way to load shared links
Code:
input conso = .02;
input outo = .01;
input coc = close;
input linRegLength = 21;
input smLength = 3;
input displace2 = 0;
input length = 10;
def bn = BarNumber();
def lastBar = HighestAll(if IsNaN(close) then 0 else bn);
def offset = Min(length - 1, lastBar - bn);
def swingLow = low < Lowest(low[1], length - 1) and low == GetValue(Lowest(low, length), -offset);
# identify the very last swing low point
def lowPointOneBarNumber = HighestAll(if swingLow then bn else 0);
def lowPointOneValue = if bn == lowPointOneBarNumber then low else lowPointOneValue[1];
def low1 = if bn < lowPointOneBarNumber then Double.NaN else lowPointOneValue;

# identify the 2nd to last swing low point
def lowPointTwoBarNumber = HighestAll(if swingLow and bn < lowPointOneBarNumber then bn else 0);
def lowPointTwoValue = if bn == lowPointTwoBarNumber then low else lowPointTwoValue[1];
def low2 = if bn < lowPointTwoBarNumber then Double.NaN else lowPointTwoValue;

# just keep doing ths for as many lines as you want to add to the chart
# identify then 3rd to last swingHigh point low
def lowPointThreeBarNumber = HighestAll(if swingLow and bn < lowPointTwoBarNumber then bn else 0);
def lowPointThreeValue = if bn == lowPointThreeBarNumber then low else lowPointThreeValue[1];
def low3 = if bn < lowPointThreeBarNumber then Double.NaN else lowPointThreeValue;

# identify then 4th to last swingHigh point low
def lowPointFourBarNumber = HighestAll(if swingLow and bn < lowPointThreeBarNumber then bn else 0);
def lowPointFourValue = if bn == lowPointFourBarNumber then low else lowPointFourValue[1];
def low4 = if bn < lowPointFourBarNumber then Double.NaN else lowPointFourValue;
# identify then 5th to last swingHigh point low
def lowPointFiveBarNumber = HighestAll(if swingLow and bn < lowPointFourBarNumber then bn else 0);
def lowPointFiveValue = if bn == lowPointFiveBarNumber then low else lowPointFiveValue[1];
def low5 = if bn < lowPointFiveBarNumber then Double.NaN else lowPointFiveValue;

# identify then 6th to last swingHigh point low
def lowPointSixBarNumber = HighestAll(if swingLow and bn < lowPointFiveBarNumber then bn else 0);
def lowPointSixValue = if bn == lowPointSixBarNumber then low else lowPointSixValue[1];
def low6 = if bn < lowPointSixBarNumber then Double.NaN else lowPointSixValue;

# identify then 7th to last swingHigh point low
def lowPointSevenBarNumber = HighestAll(if swingLow and bn < lowPointSixBarNumber then bn else 0);
def lowPointSevenValue = if bn == lowPointSevenBarNumber then low else lowPointSevenValue[1];
def low7 = if bn < lowPointSevenBarNumber then Double.NaN else lowPointSevenValue;
# identify then 8th to last swingHigh point low
def lowPointEightBarNumber = HighestAll(if swingLow and bn < lowPointSevenBarNumber then bn else 0);
def lowPointEightValue = if bn == lowPointEightBarNumber then low else lowPointEightValue[1];
def low8 = if bn < lowPointEightBarNumber then Double.NaN else lowPointEightValue;
# identify then 9th to last swingHigh point low
def lowPointNineBarNumber = HighestAll(if swingLow and bn < lowPointEightBarNumber then bn else 0);
def lowPointNineValue = if bn == lowPointNineBarNumber then low else lowPointNineValue[1];
def low9 = if bn < lowPointNineBarNumber then Double.NaN else lowPointNineValue;

# identify then 10th to last swingHigh point low
def lowPointTenBarNumber = HighestAll(if swingLow and bn < lowPointNineBarNumber then bn else 0);
def lowPointTenValue = if bn == lowPointTenBarNumber then low else lowPointTenValue[1];
def low10 = if bn < lowPointTenBarNumber then Double.NaN else lowPointTenValue;


# SWING HIGH
# define swing high points
def swingHigh = high > Highest(high[1], length - 1) and high == GetValue(Highest(high, length), -offset);
# identify the very last swing high point
def highPointOneBarNumber = HighestAll(if swingHigh then bn else 0);
def highPointOneValue = if bn == highPointOneBarNumber then high else highPointOneValue[1];
def high1 = if bn < highPointOneBarNumber then Double.NaN else highPointOneValue;
# identify the 2nd to last swing high point
def highPointTwoBarNumber = HighestAll(if swingHigh and bn < highPointOneBarNumber then bn else 0);
def highPointTwoValue = if bn == highPointTwoBarNumber then high else highPointTwoValue[1];
def high2 = if bn < highPointTwoBarNumber then Double.NaN else highPointTwoValue;

# just keep doing ths for as many lines as you want to add to the chart
def highPointThreeBarNumber = HighestAll(if swingHigh and bn < highPointTwoBarNumber then bn else 0);
def highPointThreeValue = if bn == highPointThreeBarNumber then high else highPointThreeValue[1];
def high3 = if bn < highPointThreeBarNumber then Double.NaN else highPointThreeValue;
def highPointFourBarNumber = HighestAll(if swingHigh and bn < highPointThreeBarNumber then bn else 0);
def highPointFourValue = if bn == highPointFourBarNumber then high else highPointFourValue[1];
def high4 = if bn < highPointFourBarNumber then Double.NaN else highPointFourValue;

def highPointFiveBarNumber = HighestAll(if swingHigh and bn < highPointFourBarNumber then bn else 0);
def highPointFiveValue = if bn == highPointFiveBarNumber then high else highPointFiveValue[1];
def high5 = if bn < highPointFiveBarNumber then Double.NaN else highPointFiveValue;
def highPointSixBarNumber = HighestAll(if swingHigh and bn < highPointFiveBarNumber then bn else 0);
def highPointSixValue = if bn == highPointSixBarNumber then high else highPointSixValue[1];
def high6 = if bn < highPointsixBarNumber then Double.NaN else highPointsixValue;
def highPointSevenBarNumber = HighestAll(if swingHigh and bn < highPointSixBarNumber then bn else 0);
def highPointSevenValue = if bn == highPointSevenBarNumber then high else highPointSevenValue[1];
def high7 = if bn < highPointSevenBarNumber then Double.NaN else highPointSevenValue;
def highPointEightBarNumber = HighestAll(if swingHigh and bn < highPointSevenBarNumber then bn else 0);
def highPointEightValue = if bn == highPointEightBarNumber then high else highPointEightValue[1];
def high8 = if bn < highPointEightBarNumber then Double.NaN else highPointEightValue;
def highPointNineBarNumber = HighestAll(if swingHigh and bn < highPointEightBarNumber then bn else 0);
def highPointNineValue = if bn == highPointNineBarNumber then high else highPointNineValue[1];
def high9 = if bn < highPointNineBarNumber then Double.NaN else highPointNineValue;

def highPointTenBarNumber = HighestAll(if swingHigh and bn < highPointNineBarNumber then bn else 0);
def highPointTenValue = if bn == highPointTenBarNumber then high else highPointTenValue[1];
def high10 = if bn < highPointTenBarNumber then Double.NaN else highPointTenValue;


# ADJUST CANDLE COLORS
# change candle colors just to make it easier to see what we are working with
AssignPriceColor(if swingLow then Color.cyan else if swingHigh then Color.mageNTA else Color.current);
# End Swing High and Swing Low


def value = Average(Inertia(coc[-displace2], linRegLength), smLength);
def error = Average(sterr(coc[-displace2], linRegLength), smLength);
def MiddleLine = value;
def total = if close < open then (high + 2 * low + close) / 2 else if close > open then (2 * high + low + close) / 2 else (high + low + 2 * close) / 2;
def UpperPr = total[1] - low[1];
def LowerPr = total[1] - high[1];

def price = close;
def length4 = 10;
def displace = 0;
def AvgExp = ExpAverage(price[-displace], length4);
def length6 = 48.5;
def AvgExp2 = ExpAverage(price[-displace], length6);
def c = close;

def length2 = 30;
def calclength2 = 5;
def smoothlength2 = 3;
input agg = AggregationPeriod.DAY;

def o10 = open(period = agg);
def c10 = close(period = agg);
def data = fold i = 0 to length2
with s
do s + (if c10 > GetValue(o10, i)
then 1
else if c10 < GetValue(o10, i)
then - 1
else 0);
def EMA5 = ExpAverage(data, calclength2);
def Main = ExpAverage(EMA5, smoothLength2);
def Signal = ExpAverage(Main, smoothLength2);

def ob3 = if IsNaN(c10) then Double.NaN else Round(length2 * .7);

input BuyEntry = 3;
input SellEntry = 3;

plot QB = Highest(high, BuyEntry);
plot QS = Lowest(low, SellEntry);

plot midline = (qs[1]+qb[1])/2;

plot differencechange = ((main-signal) < 1) and ((main - signal) > -1) and (main < ob3);


plot comboupstrongstrongstrong = (close > qb[1]) and (c[1] < qb[2]) and (((open - qb[1])/100) < outo) and (((qb[1] - Avgexp)/100) < conso) and (close < midline[1]);

plot comboupstrongstrong = (close > qb[1]) and (c[1] < qb[2]) and (((open - qb[1])/100) < outo) and (((qb[1] - Avgexp)/100) < conso) and (open[1] or open[2] or open[3] < midline) and comboupstrongstrongstrong is false and (open < qb[1]) and (open[1] > Qs[2]) and (close[1] < midline[2]);

plot comboupstrong = (close > qb[1]) and (close[1] < qb[2]) and (((open - qb[1])/100) < outo) and (((qb[1] - Avgexp)/100) < conso) and comboupstrongstrongstrong is false and comboupstrongstrong is false and (close > open) and (low < middleline) and (close > open);

plot midcrossgapup = (((open < midline) and ((close > midline)) or ((close[1] < midline[2])) and (open > midline[1]))) and (close > open) and (differencechange) and (close[1] < qb[2]) and (close > upperpr);

plot combodown = (qs[1] > qs[2]) and (close < qs[1]) and (c[1] > qs[2]) and (((qs[1] - open)/100) < outo) and (((Avgexp - qs[1])/100) < conso);
plot midcrossgapdown = (((open > midline) and ((close < midline)) or ((close[1] > midline[2])) and (open < midline[1]))) and (close < open) and (close[1] > qs[2]) and (close < lowerpr);

plot goodsetup =((swinglow or swinglow[1] or swinglow[2])) and ((comboupstrong or comboupstrongstrong or comboupstrongstrongstrong or midcrossgapup));

plot sellputs = (lowerpr < QS);
Last edited by a moderator:
This MTF scan will never work because secondary aggregations cannot be used in the scan hacker.
The MTF portion has been removed from the script which means this scan won't match your charts.
Even with that, this scan has EIGHT different scan statements. But scans can only have one.
SEVEN of the plot statements have been commented out.
You did not indicate which of the eight conditions you were attempting to scan for; so one was chosen at random. Feel free to change to one of the other seven.
shared scan link: http://tos.mx/LZUG8yi Click here for --> Easiest way to load shared links
Is this for buy or sell scan. Can you write the code for buy and sell scan? Thanks separately
Sorry, I don't know which of the seven scan plots is for your "arrow green arrow triggers up"How can i create a custom scan that signals when the arrow green arrow triggers up?
input conso = .02;
input outo = .01;
input coc = close;
input linRegLength = 21;
input smLength = 3;
input displace2 = 0;
input length = 10;
def bn = BarNumber();
def lastBar = HighestAll(if IsNaN(close) then 0 else bn);
def offset = Min(length - 1, lastBar - bn);
def swingLow = low < Lowest(low[1], length - 1) and low == GetValue(Lowest(low, length), -offset);
# identify the very last swing low point
def lowPointOneBarNumber = HighestAll(if swingLow then bn else 0);
def lowPointOneValue = if bn == lowPointOneBarNumber then low else lowPointOneValue[1];
def low1 = if bn < lowPointOneBarNumber then Double.NaN else lowPointOneValue;

# identify the 2nd to last swing low point
def lowPointTwoBarNumber = HighestAll(if swingLow and bn < lowPointOneBarNumber then bn else 0);
def lowPointTwoValue = if bn == lowPointTwoBarNumber then low else lowPointTwoValue[1];
def low2 = if bn < lowPointTwoBarNumber then Double.NaN else lowPointTwoValue;

# just keep doing ths for as many lines as you want to add to the chart
# identify then 3rd to last swingHigh point low
def lowPointThreeBarNumber = HighestAll(if swingLow and bn < lowPointTwoBarNumber then bn else 0);
def lowPointThreeValue = if bn == lowPointThreeBarNumber then low else lowPointThreeValue[1];
def low3 = if bn < lowPointThreeBarNumber then Double.NaN else lowPointThreeValue;

# identify then 4th to last swingHigh point low
def lowPointFourBarNumber = HighestAll(if swingLow and bn < lowPointThreeBarNumber then bn else 0);
def lowPointFourValue = if bn == lowPointFourBarNumber then low else lowPointFourValue[1];
def low4 = if bn < lowPointFourBarNumber then Double.NaN else lowPointFourValue;
# identify then 5th to last swingHigh point low
def lowPointFiveBarNumber = HighestAll(if swingLow and bn < lowPointFourBarNumber then bn else 0);
def lowPointFiveValue = if bn == lowPointFiveBarNumber then low else lowPointFiveValue[1];
def low5 = if bn < lowPointFiveBarNumber then Double.NaN else lowPointFiveValue;

# identify then 6th to last swingHigh point low
def lowPointSixBarNumber = HighestAll(if swingLow and bn < lowPointFiveBarNumber then bn else 0);
def lowPointSixValue = if bn == lowPointSixBarNumber then low else lowPointSixValue[1];
def low6 = if bn < lowPointSixBarNumber then Double.NaN else lowPointSixValue;

# identify then 7th to last swingHigh point low
def lowPointSevenBarNumber = HighestAll(if swingLow and bn < lowPointSixBarNumber then bn else 0);
def lowPointSevenValue = if bn == lowPointSevenBarNumber then low else lowPointSevenValue[1];
def low7 = if bn < lowPointSevenBarNumber then Double.NaN else lowPointSevenValue;
# identify then 8th to last swingHigh point low
def lowPointEightBarNumber = HighestAll(if swingLow and bn < lowPointSevenBarNumber then bn else 0);
def lowPointEightValue = if bn == lowPointEightBarNumber then low else lowPointEightValue[1];
def low8 = if bn < lowPointEightBarNumber then Double.NaN else lowPointEightValue;
# identify then 9th to last swingHigh point low
def lowPointNineBarNumber = HighestAll(if swingLow and bn < lowPointEightBarNumber then bn else 0);
def lowPointNineValue = if bn == lowPointNineBarNumber then low else lowPointNineValue[1];
def low9 = if bn < lowPointNineBarNumber then Double.NaN else lowPointNineValue;

# identify then 10th to last swingHigh point low
def lowPointTenBarNumber = HighestAll(if swingLow and bn < lowPointNineBarNumber then bn else 0);
def lowPointTenValue = if bn == lowPointTenBarNumber then low else lowPointTenValue[1];
def low10 = if bn < lowPointTenBarNumber then Double.NaN else lowPointTenValue;


# SWING HIGH
# define swing high points
def swingHigh = high > Highest(high[1], length - 1) and high == GetValue(Highest(high, length), -offset);
# identify the very last swing high point
def highPointOneBarNumber = HighestAll(if swingHigh then bn else 0);
def highPointOneValue = if bn == highPointOneBarNumber then high else highPointOneValue[1];
def high1 = if bn < highPointOneBarNumber then Double.NaN else highPointOneValue;
# identify the 2nd to last swing high point
def highPointTwoBarNumber = HighestAll(if swingHigh and bn < highPointOneBarNumber then bn else 0);
def highPointTwoValue = if bn == highPointTwoBarNumber then high else highPointTwoValue[1];
def high2 = if bn < highPointTwoBarNumber then Double.NaN else highPointTwoValue;

# just keep doing ths for as many lines as you want to add to the chart
def highPointThreeBarNumber = HighestAll(if swingHigh and bn < highPointTwoBarNumber then bn else 0);
def highPointThreeValue = if bn == highPointThreeBarNumber then high else highPointThreeValue[1];
def high3 = if bn < highPointThreeBarNumber then Double.NaN else highPointThreeValue;
def highPointFourBarNumber = HighestAll(if swingHigh and bn < highPointThreeBarNumber then bn else 0);
def highPointFourValue = if bn == highPointFourBarNumber then high else highPointFourValue[1];
def high4 = if bn < highPointFourBarNumber then Double.NaN else highPointFourValue;

def highPointFiveBarNumber = HighestAll(if swingHigh and bn < highPointFourBarNumber then bn else 0);
def highPointFiveValue = if bn == highPointFiveBarNumber then high else highPointFiveValue[1];
def high5 = if bn < highPointFiveBarNumber then Double.NaN else highPointFiveValue;
def highPointSixBarNumber = HighestAll(if swingHigh and bn < highPointFiveBarNumber then bn else 0);
def highPointSixValue = if bn == highPointSixBarNumber then high else highPointSixValue[1];
def high6 = if bn < highPointsixBarNumber then Double.NaN else highPointsixValue;
def highPointSevenBarNumber = HighestAll(if swingHigh and bn < highPointSixBarNumber then bn else 0);
def highPointSevenValue = if bn == highPointSevenBarNumber then high else highPointSevenValue[1];
def high7 = if bn < highPointSevenBarNumber then Double.NaN else highPointSevenValue;
def highPointEightBarNumber = HighestAll(if swingHigh and bn < highPointSevenBarNumber then bn else 0);
def highPointEightValue = if bn == highPointEightBarNumber then high else highPointEightValue[1];
def high8 = if bn < highPointEightBarNumber then Double.NaN else highPointEightValue;
def highPointNineBarNumber = HighestAll(if swingHigh and bn < highPointEightBarNumber then bn else 0);
def highPointNineValue = if bn == highPointNineBarNumber then high else highPointNineValue[1];
def high9 = if bn < highPointNineBarNumber then Double.NaN else highPointNineValue;

def highPointTenBarNumber = HighestAll(if swingHigh and bn < highPointNineBarNumber then bn else 0);
def highPointTenValue = if bn == highPointTenBarNumber then high else highPointTenValue[1];
def high10 = if bn < highPointTenBarNumber then Double.NaN else highPointTenValue;


# ADJUST CANDLE COLORS
# change candle colors just to make it easier to see what we are working with
AssignPriceColor(if swingLow then Color.cyan else if swingHigh then Color.mageNTA else Color.current);
# End Swing High and Swing Low


def value = Average(Inertia(coc[-displace2], linRegLength), smLength);
def error = Average(sterr(coc[-displace2], linRegLength), smLength);
def MiddleLine = value;
def total = if close < open then (high + 2 * low + close) / 2 else if close > open then (2 * high + low + close) / 2 else (high + low + 2 * close) / 2;
def UpperPr = total[1] - low[1];
def LowerPr = total[1] - high[1];

def price = close;
def length4 = 10;
def displace = 0;
def AvgExp = ExpAverage(price[-displace], length4);
def length6 = 48.5;
def AvgExp2 = ExpAverage(price[-displace], length6);
def c = close;

def length2 = 30;
def calclength2 = 5;
def smoothlength2 = 3;
input agg = AggregationPeriod.DAY;

def o10 = open(period = agg);
def c10 = close(period = agg);
def data = fold i = 0 to length2
with s
do s + (if c10 > GetValue(o10, i)
then 1
else if c10 < GetValue(o10, i)
then - 1
else 0);
def EMA5 = ExpAverage(data, calclength2);
def Main = ExpAverage(EMA5, smoothLength2);
def Signal = ExpAverage(Main, smoothLength2);

def ob3 = if IsNaN(c10) then Double.NaN else Round(length2 * .7);

input BuyEntry = 3;
input SellEntry = 3;

plot QB = Highest(high, BuyEntry);
plot QS = Lowest(low, SellEntry);

plot midline = (qs[1]+qb[1])/2;

plot differencechange = ((main-signal) < 1) and ((main - signal) > -1) and (main < ob3);


plot comboupstrongstrongstrong = (close > qb[1]) and (c[1] < qb[2]) and (((open - qb[1])/100) < outo) and (((qb[1] - Avgexp)/100) < conso) and (close < midline[1]);

plot comboupstrongstrong = (close > qb[1]) and (c[1] < qb[2]) and (((open - qb[1])/100) < outo) and (((qb[1] - Avgexp)/100) < conso) and (open[1] or open[2] or open[3] < midline) and comboupstrongstrongstrong is false and (open < qb[1]) and (open[1] > Qs[2]) and (close[1] < midline[2]);

plot comboupstrong = (close > qb[1]) and (close[1] < qb[2]) and (((open - qb[1])/100) < outo) and (((qb[1] - Avgexp)/100) < conso) and comboupstrongstrongstrong is false and comboupstrongstrong is false and (close > open) and (low < middleline) and (close > open);

plot midcrossgapup = (((open < midline) and ((close > midline)) or ((close[1] < midline[2])) and (open > midline[1]))) and (close > open) and (differencechange) and (close[1] < qb[2]) and (close > upperpr);

plot combodown = (qs[1] > qs[2]) and (close < qs[1]) and (c[1] > qs[2]) and (((qs[1] - open)/100) < outo) and (((Avgexp - qs[1])/100) < conso);
plot midcrossgapdown = (((open > midline) and ((close < midline)) or ((close[1] > midline[2])) and (open < midline[1]))) and (close < open) and (close[1] > qs[2]) and (close < lowerpr);

plot goodsetup =((swinglow or swinglow[1] or swinglow[2])) and ((comboupstrong or comboupstrongstrong or comboupstrongstrongstrong or midcrossgapup));

plot sellputs = (lowerpr < QS);
best guess == midcrossgapup
1. save your study in your study tab
2. select your study in the scanner
3. your scan filter would be:
midcrossgapup is true
Yes, @majidg there are buy/sell signals in this study
if the above is not the one you want;
in the scanner,
1. select each one of the seven plots in the selection box (separately; one at a time);
2. make the criteria "is true"
until you get back the results that you are looking for.
Here is a tutorial for adding the scan filter to the scanner:
https://usethinkscript.com/threads/how-to-use-thinkorswim-stock-hacker-scans.284/
Last edited by a moderator:
Can anyone help create a watchlist indicator for the specific section of this indicator. I have tried but keep failing?
https://usethinkscript.com/threads/potential-breakout-arrow-plots-indicator-for-thinkorswim.1874/
https://usethinkscript.com/threads/potential-breakout-arrow-plots-indicator-for-thinkorswim.1874/
Code:
input conso = .02;
input outo = .01;
input coc = close;
input linRegLength = 21;
input smLength = 3;
input displace2 = 0;
input length = 10;
def bn = BarNumber();
def lastBar = HighestAll(if IsNaN(close) then 0 else bn);
def offset = Min(length - 1, lastBar - bn);
def swingLow = low < Lowest(low[1], length - 1) and low == GetValue(Lowest(low, length), -offset);
# identify the very last swing low point
def lowPointOneBarNumber = HighestAll(if swingLow then bn else 0);
def lowPointOneValue = if bn == lowPointOneBarNumber then low else lowPointOneValue[1];
def low1 = if bn < lowPointOneBarNumber then Double.NaN else lowPointOneValue;

# identify the 2nd to last swing low point
def lowPointTwoBarNumber = HighestAll(if swingLow and bn < lowPointOneBarNumber then bn else 0);
def lowPointTwoValue = if bn == lowPointTwoBarNumber then low else lowPointTwoValue[1];
def low2 = if bn < lowPointTwoBarNumber then Double.NaN else lowPointTwoValue;

# just keep doing ths for as many lines as you want to add to the chart
# identify then 3rd to last swingHigh point low
def lowPointThreeBarNumber = HighestAll(if swingLow and bn < lowPointTwoBarNumber then bn else 0);
def lowPointThreeValue = if bn == lowPointThreeBarNumber then low else lowPointThreeValue[1];
def low3 = if bn < lowPointThreeBarNumber then Double.NaN else lowPointThreeValue;

# identify then 4th to last swingHigh point low
def lowPointFourBarNumber = HighestAll(if swingLow and bn < lowPointThreeBarNumber then bn else 0);
def lowPointFourValue = if bn == lowPointFourBarNumber then low else lowPointFourValue[1];
def low4 = if bn < lowPointFourBarNumber then Double.NaN else lowPointFourValue;
# identify then 5th to last swingHigh point low
def lowPointFiveBarNumber = HighestAll(if swingLow and bn < lowPointFourBarNumber then bn else 0);
def lowPointFiveValue = if bn == lowPointFiveBarNumber then low else lowPointFiveValue[1];
def low5 = if bn < lowPointFiveBarNumber then Double.NaN else lowPointFiveValue;

# identify then 6th to last swingHigh point low
def lowPointSixBarNumber = HighestAll(if swingLow and bn < lowPointFiveBarNumber then bn else 0);
def lowPointSixValue = if bn == lowPointSixBarNumber then low else lowPointSixValue[1];
def low6 = if bn < lowPointSixBarNumber then Double.NaN else lowPointSixValue;

# identify then 7th to last swingHigh point low
def lowPointSevenBarNumber = HighestAll(if swingLow and bn < lowPointSixBarNumber then bn else 0);
def lowPointSevenValue = if bn == lowPointSevenBarNumber then low else lowPointSevenValue[1];
def low7 = if bn < lowPointSevenBarNumber then Double.NaN else lowPointSevenValue;
# identify then 8th to last swingHigh point low
def lowPointEightBarNumber = HighestAll(if swingLow and bn < lowPointSevenBarNumber then bn else 0);
def lowPointEightValue = if bn == lowPointEightBarNumber then low else lowPointEightValue[1];
def low8 = if bn < lowPointEightBarNumber then Double.NaN else lowPointEightValue;
# identify then 9th to last swingHigh point low
def lowPointNineBarNumber = HighestAll(if swingLow and bn < lowPointEightBarNumber then bn else 0);
def lowPointNineValue = if bn == lowPointNineBarNumber then low else lowPointNineValue[1];
def low9 = if bn < lowPointNineBarNumber then Double.NaN else lowPointNineValue;

# identify then 10th to last swingHigh point low
def lowPointTenBarNumber = HighestAll(if swingLow and bn < lowPointNineBarNumber then bn else 0);
def lowPointTenValue = if bn == lowPointTenBarNumber then low else lowPointTenValue[1];
def low10 = if bn < lowPointTenBarNumber then Double.NaN else lowPointTenValue;


# SWING HIGH
# define swing high points
def swingHigh = high > Highest(high[1], length - 1) and high == GetValue(Highest(high, length), -offset);
# identify the very last swing high point
def highPointOneBarNumber = HighestAll(if swingHigh then bn else 0);
def highPointOneValue = if bn == highPointOneBarNumber then high else highPointOneValue[1];
def high1 = if bn < highPointOneBarNumber then Double.NaN else highPointOneValue;
# identify the 2nd to last swing high point
def highPointTwoBarNumber = HighestAll(if swingHigh and bn < highPointOneBarNumber then bn else 0);
def highPointTwoValue = if bn == highPointTwoBarNumber then high else highPointTwoValue[1];
def high2 = if bn < highPointTwoBarNumber then Double.NaN else highPointTwoValue;

# just keep doing ths for as many lines as you want to add to the chart
def highPointThreeBarNumber = HighestAll(if swingHigh and bn < highPointTwoBarNumber then bn else 0);
def highPointThreeValue = if bn == highPointThreeBarNumber then high else highPointThreeValue[1];
def high3 = if bn < highPointThreeBarNumber then Double.NaN else highPointThreeValue;
def highPointFourBarNumber = HighestAll(if swingHigh and bn < highPointThreeBarNumber then bn else 0);
def highPointFourValue = if bn == highPointFourBarNumber then high else highPointFourValue[1];
def high4 = if bn < highPointFourBarNumber then Double.NaN else highPointFourValue;

def highPointFiveBarNumber = HighestAll(if swingHigh and bn < highPointFourBarNumber then bn else 0);
def highPointFiveValue = if bn == highPointFiveBarNumber then high else highPointFiveValue[1];
def high5 = if bn < highPointFiveBarNumber then Double.NaN else highPointFiveValue;
def highPointSixBarNumber = HighestAll(if swingHigh and bn < highPointFiveBarNumber then bn else 0);
def highPointSixValue = if bn == highPointSixBarNumber then high else highPointSixValue[1];
def high6 = if bn < highPointsixBarNumber then Double.NaN else highPointsixValue;
def highPointSevenBarNumber = HighestAll(if swingHigh and bn < highPointSixBarNumber then bn else 0);
def highPointSevenValue = if bn == highPointSevenBarNumber then high else highPointSevenValue[1];
def high7 = if bn < highPointSevenBarNumber then Double.NaN else highPointSevenValue;
def highPointEightBarNumber = HighestAll(if swingHigh and bn < highPointSevenBarNumber then bn else 0);
def highPointEightValue = if bn == highPointEightBarNumber then high else highPointEightValue[1];
def high8 = if bn < highPointEightBarNumber then Double.NaN else highPointEightValue;
def highPointNineBarNumber = HighestAll(if swingHigh and bn < highPointEightBarNumber then bn else 0);
def highPointNineValue = if bn == highPointNineBarNumber then high else highPointNineValue[1];
def high9 = if bn < highPointNineBarNumber then Double.NaN else highPointNineValue;

def highPointTenBarNumber = HighestAll(if swingHigh and bn < highPointNineBarNumber then bn else 0);
def highPointTenValue = if bn == highPointTenBarNumber then high else highPointTenValue[1];
def high10 = if bn < highPointTenBarNumber then Double.NaN else highPointTenValue;


# ADJUST CANDLE COLORS
# change candle colors just to make it easier to see what we are working with
AssignPriceColor(if swingLow then Color.cyan else if swingHigh then Color.mageNTA else Color.current);
# End Swing High and Swing Low


def value = Average(Inertia(coc[-displace2], linRegLength), smLength);
def error = Average(sterr(coc[-displace2], linRegLength), smLength);
def MiddleLine = value;
def total = if close < open then (high + 2 * low + close) / 2 else if close > open then (2 * high + low + close) / 2 else (high + low + 2 * close) / 2;
def UpperPr = total[1] - low[1];
def LowerPr = total[1] - high[1];

def price = close;
def length4 = 10;
def displace = 0;
def AvgExp = ExpAverage(price[-displace], length4);
def length6 = 48.5;
def AvgExp2 = ExpAverage(price[-displace], length6);
def c = close;

def length2 = 30;
def calclength2 = 5;
def smoothlength2 = 3;
input agg = AggregationPeriod.DAY;

def o10 = open(period = agg);
def c10 = close(period = agg);
def data = fold i = 0 to length2
with s
do s + (if c10 > GetValue(o10, i)
then 1
else if c10 < GetValue(o10, i)
then - 1
else 0);
def EMA5 = ExpAverage(data, calclength2);
def Main = ExpAverage(EMA5, smoothLength2);
def Signal = ExpAverage(Main, smoothLength2);

def ob3 = if IsNaN(c10) then Double.NaN else Round(length2 * .7);

input BuyEntry = 3;
input SellEntry = 3;

plot QB = Highest(high, BuyEntry);
plot QS = Lowest(low, SellEntry);

plot midline = (qs[1]+qb[1])/2;

plot differencechange = ((main-signal) < 1) and ((main - signal) > -1) and (main < ob3);


plot comboupstrongstrongstrong = (close > qb[1]) and (c[1] < qb[2]) and (((open - qb[1])/100) < outo) and (((qb[1] - Avgexp)/100) < conso) and (close < midline[1]);

plot comboupstrongstrong = (close > qb[1]) and (c[1] < qb[2]) and (((open - qb[1])/100) < outo) and (((qb[1] - Avgexp)/100) < conso) and (open[1] or open[2] or open[3] < midline) and comboupstrongstrongstrong is false and (open < qb[1]) and (open[1] > Qs[2]) and (close[1] < midline[2]);

plot comboupstrong = (close > qb[1]) and (close[1] < qb[2]) and (((open - qb[1])/100) < outo) and (((qb[1] - Avgexp)/100) < conso) and comboupstrongstrongstrong is false and comboupstrongstrong is false and (close > open) and (low < middleline) and (close > open);

plot midcrossgapup = (((open < midline) and ((close > midline)) or ((close[1] < midline[2])) and (open > midline[1]))) and (close > open) and (differencechange) and (close[1] < qb[2]) and (close > upperpr);

plot combodown = (qs[1] > qs[2]) and (close < qs[1]) and (c[1] > qs[2]) and (((qs[1] - open)/100) < outo) and (((Avgexp - qs[1])/100) < conso);
plot midcrossgapdown = (((open > midline) and ((close < midline)) or ((close[1] > midline[2])) and (open < midline[1]))) and (close < open) and (close[1] > qs[2]) and (close < lowerpr);

plot goodsetup =((swinglow or swinglow[1] or swinglow[2])) and ((comboupstrong or comboupstrongstrong or comboupstrongstrongstrong or midcrossgapup));

plot sellputs = (lowerpr < QS);Attachments
Last edited by a moderator:
Can anyone help create a watchlist indicator for the specific section of this indicator. I have tried but keep failing?
https://usethinkscript.com/threads/potential-breakout-arrow-plots-indicator-for-thinkorswim.1874/
Code:input conso = .02; input outo = .01; input coc = close; input linRegLength = 21; input smLength = 3; input displace2 = 0; input length = 10; def bn = BarNumber(); def lastBar = HighestAll(if IsNaN(close) then 0 else bn); def offset = Min(length - 1, lastBar - bn); def swingLow = low < Lowest(low[1], length - 1) and low == GetValue(Lowest(low, length), -offset); # identify the very last swing low point def lowPointOneBarNumber = HighestAll(if swingLow then bn else 0); def lowPointOneValue = if bn == lowPointOneBarNumber then low else lowPointOneValue[1]; def low1 = if bn < lowPointOneBarNumber then Double.NaN else lowPointOneValue; # identify the 2nd to last swing low point def lowPointTwoBarNumber = HighestAll(if swingLow and bn < lowPointOneBarNumber then bn else 0); def lowPointTwoValue = if bn == lowPointTwoBarNumber then low else lowPointTwoValue[1]; def low2 = if bn < lowPointTwoBarNumber then Double.NaN else lowPointTwoValue; # just keep doing ths for as many lines as you want to add to the chart # identify then 3rd to last swingHigh point low def lowPointThreeBarNumber = HighestAll(if swingLow and bn < lowPointTwoBarNumber then bn else 0); def lowPointThreeValue = if bn == lowPointThreeBarNumber then low else lowPointThreeValue[1]; def low3 = if bn < lowPointThreeBarNumber then Double.NaN else lowPointThreeValue; # identify then 4th to last swingHigh point low def lowPointFourBarNumber = HighestAll(if swingLow and bn < lowPointThreeBarNumber then bn else 0); def lowPointFourValue = if bn == lowPointFourBarNumber then low else lowPointFourValue[1]; def low4 = if bn < lowPointFourBarNumber then Double.NaN else lowPointFourValue; # identify then 5th to last swingHigh point low def lowPointFiveBarNumber = HighestAll(if swingLow and bn < lowPointFourBarNumber then bn else 0); def lowPointFiveValue = if bn == lowPointFiveBarNumber then low else lowPointFiveValue[1]; def low5 = if bn < lowPointFiveBarNumber then Double.NaN else lowPointFiveValue; # identify then 6th to last swingHigh point low def lowPointSixBarNumber = HighestAll(if swingLow and bn < lowPointFiveBarNumber then bn else 0); def lowPointSixValue = if bn == lowPointSixBarNumber then low else lowPointSixValue[1]; def low6 = if bn < lowPointSixBarNumber then Double.NaN else lowPointSixValue; # identify then 7th to last swingHigh point low def lowPointSevenBarNumber = HighestAll(if swingLow and bn < lowPointSixBarNumber then bn else 0); def lowPointSevenValue = if bn == lowPointSevenBarNumber then low else lowPointSevenValue[1]; def low7 = if bn < lowPointSevenBarNumber then Double.NaN else lowPointSevenValue; # identify then 8th to last swingHigh point low def lowPointEightBarNumber = HighestAll(if swingLow and bn < lowPointSevenBarNumber then bn else 0); def lowPointEightValue = if bn == lowPointEightBarNumber then low else lowPointEightValue[1]; def low8 = if bn < lowPointEightBarNumber then Double.NaN else lowPointEightValue; # identify then 9th to last swingHigh point low def lowPointNineBarNumber = HighestAll(if swingLow and bn < lowPointEightBarNumber then bn else 0); def lowPointNineValue = if bn == lowPointNineBarNumber then low else lowPointNineValue[1]; def low9 = if bn < lowPointNineBarNumber then Double.NaN else lowPointNineValue; # identify then 10th to last swingHigh point low def lowPointTenBarNumber = HighestAll(if swingLow and bn < lowPointNineBarNumber then bn else 0); def lowPointTenValue = if bn == lowPointTenBarNumber then low else lowPointTenValue[1]; def low10 = if bn < lowPointTenBarNumber then Double.NaN else lowPointTenValue; # SWING HIGH # define swing high points def swingHigh = high > Highest(high[1], length - 1) and high == GetValue(Highest(high, length), -offset); # identify the very last swing high point def highPointOneBarNumber = HighestAll(if swingHigh then bn else 0); def highPointOneValue = if bn == highPointOneBarNumber then high else highPointOneValue[1]; def high1 = if bn < highPointOneBarNumber then Double.NaN else highPointOneValue; # identify the 2nd to last swing high point def highPointTwoBarNumber = HighestAll(if swingHigh and bn < highPointOneBarNumber then bn else 0); def highPointTwoValue = if bn == highPointTwoBarNumber then high else highPointTwoValue[1]; def high2 = if bn < highPointTwoBarNumber then Double.NaN else highPointTwoValue; # just keep doing ths for as many lines as you want to add to the chart def highPointThreeBarNumber = HighestAll(if swingHigh and bn < highPointTwoBarNumber then bn else 0); def highPointThreeValue = if bn == highPointThreeBarNumber then high else highPointThreeValue[1]; def high3 = if bn < highPointThreeBarNumber then Double.NaN else highPointThreeValue; def highPointFourBarNumber = HighestAll(if swingHigh and bn < highPointThreeBarNumber then bn else 0); def highPointFourValue = if bn == highPointFourBarNumber then high else highPointFourValue[1]; def high4 = if bn < highPointFourBarNumber then Double.NaN else highPointFourValue; def highPointFiveBarNumber = HighestAll(if swingHigh and bn < highPointFourBarNumber then bn else 0); def highPointFiveValue = if bn == highPointFiveBarNumber then high else highPointFiveValue[1]; def high5 = if bn < highPointFiveBarNumber then Double.NaN else highPointFiveValue; def highPointSixBarNumber = HighestAll(if swingHigh and bn < highPointFiveBarNumber then bn else 0); def highPointSixValue = if bn == highPointSixBarNumber then high else highPointSixValue[1]; def high6 = if bn < highPointsixBarNumber then Double.NaN else highPointsixValue; def highPointSevenBarNumber = HighestAll(if swingHigh and bn < highPointSixBarNumber then bn else 0); def highPointSevenValue = if bn == highPointSevenBarNumber then high else highPointSevenValue[1]; def high7 = if bn < highPointSevenBarNumber then Double.NaN else highPointSevenValue; def highPointEightBarNumber = HighestAll(if swingHigh and bn < highPointSevenBarNumber then bn else 0); def highPointEightValue = if bn == highPointEightBarNumber then high else highPointEightValue[1]; def high8 = if bn < highPointEightBarNumber then Double.NaN else highPointEightValue; def highPointNineBarNumber = HighestAll(if swingHigh and bn < highPointEightBarNumber then bn else 0); def highPointNineValue = if bn == highPointNineBarNumber then high else highPointNineValue[1]; def high9 = if bn < highPointNineBarNumber then Double.NaN else highPointNineValue; def highPointTenBarNumber = HighestAll(if swingHigh and bn < highPointNineBarNumber then bn else 0); def highPointTenValue = if bn == highPointTenBarNumber then high else highPointTenValue[1]; def high10 = if bn < highPointTenBarNumber then Double.NaN else highPointTenValue; # ADJUST CANDLE COLORS # change candle colors just to make it easier to see what we are working with AssignPriceColor(if swingLow then Color.cyan else if swingHigh then Color.mageNTA else Color.current); # End Swing High and Swing Low def value = Average(Inertia(coc[-displace2], linRegLength), smLength); def error = Average(sterr(coc[-displace2], linRegLength), smLength); def MiddleLine = value; def total = if close < open then (high + 2 * low + close) / 2 else if close > open then (2 * high + low + close) / 2 else (high + low + 2 * close) / 2; def UpperPr = total[1] - low[1]; def LowerPr = total[1] - high[1]; def price = close; def length4 = 10; def displace = 0; def AvgExp = ExpAverage(price[-displace], length4); def length6 = 48.5; def AvgExp2 = ExpAverage(price[-displace], length6); def c = close; def length2 = 30; def calclength2 = 5; def smoothlength2 = 3; input agg = AggregationPeriod.DAY; def o10 = open(period = agg); def c10 = close(period = agg); def data = fold i = 0 to length2 with s do s + (if c10 > GetValue(o10, i) then 1 else if c10 < GetValue(o10, i) then - 1 else 0); def EMA5 = ExpAverage(data, calclength2); def Main = ExpAverage(EMA5, smoothLength2); def Signal = ExpAverage(Main, smoothLength2); def ob3 = if IsNaN(c10) then Double.NaN else Round(length2 * .7); input BuyEntry = 3; input SellEntry = 3; plot QB = Highest(high, BuyEntry); plot QS = Lowest(low, SellEntry); plot midline = (qs[1]+qb[1])/2; plot differencechange = ((main-signal) < 1) and ((main - signal) > -1) and (main < ob3); plot comboupstrongstrongstrong = (close > qb[1]) and (c[1] < qb[2]) and (((open - qb[1])/100) < outo) and (((qb[1] - Avgexp)/100) < conso) and (close < midline[1]); plot comboupstrongstrong = (close > qb[1]) and (c[1] < qb[2]) and (((open - qb[1])/100) < outo) and (((qb[1] - Avgexp)/100) < conso) and (open[1] or open[2] or open[3] < midline) and comboupstrongstrongstrong is false and (open < qb[1]) and (open[1] > Qs[2]) and (close[1] < midline[2]); plot comboupstrong = (close > qb[1]) and (close[1] < qb[2]) and (((open - qb[1])/100) < outo) and (((qb[1] - Avgexp)/100) < conso) and comboupstrongstrongstrong is false and comboupstrongstrong is false and (close > open) and (low < middleline) and (close > open); plot midcrossgapup = (((open < midline) and ((close > midline)) or ((close[1] < midline[2])) and (open > midline[1]))) and (close > open) and (differencechange) and (close[1] < qb[2]) and (close > upperpr); plot combodown = (qs[1] > qs[2]) and (close < qs[1]) and (c[1] > qs[2]) and (((qs[1] - open)/100) < outo) and (((Avgexp - qs[1])/100) < conso); plot midcrossgapdown = (((open > midline) and ((close < midline)) or ((close[1] > midline[2])) and (open < midline[1]))) and (close < open) and (close[1] > qs[2]) and (close < lowerpr); plot goodsetup =((swinglow or swinglow[1] or swinglow[2])) and ((comboupstrong or comboupstrongstrong or comboupstrongstrongstrong or midcrossgapup)); plot sellputs = (lowerpr < QS);
Sadly, no.
This is a repainting script.
It waits for future price action to confirm a condition and then goes back and retroactively paints a signal on an earlier candle. As a result, the historical chart looks much cleaner than what was actually seen in real time.
This creates the illusion that the signal was present all along, when in reality it did not exist until several bars later.
Because Thinkorswim watchlists, scanners, and other widgets evaluate conditions in real time, a signal that is later painted onto a historical candle cannot be detected when it actually occurs. For this reason, repainting studies are sub-optimal for scanners, watchlists, or trading strategies.
Which is why forum guidelines do not permit the publication of repainting strategies, scanners, or watchlists.
The only repainting studies permitted on the forum are those plotted directly on a chart and clearly identified with a Repaints tag.
These are allowed because some traders use them as an early visual heads-up in conjunction with other indicators. They understand that the signal may disappear on the next tick or later be moved to a previous bar as additional price data becomes available. But they are not using those signals in their trading decisions, so they are not affected by the repainting behavior.
Last edited by a moderator:
Join useThinkScript to post your question to a community of 21,000+ developers and traders.
Similar threads
-
-

-
 Gap Indicator, Watchlist, Label, Scan for ThinkorSwim - Highlight Potential Gap
- Started by BenTen
- Replies: 80
-

-

Not the exact question you're looking for?
Start a new thread and receive assistance from our community.
87k+
Posts
1834
Online
Similar threads
-
-
-
Gap Indicator, Watchlist, Label, Scan for ThinkorSwim - Highlight Potential Gap
- Started by BenTen
- Replies: 80
-
-
Similar threads
-
-
-
Gap Indicator, Watchlist, Label, Scan for ThinkorSwim - Highlight Potential Gap
- Started by BenTen
- Replies: 80
-
-
The Market Trading Game Changer
Join 2,500+ subscribers inside the useThinkScript VIP Membership Club
- Exclusive indicators
- Proven strategies & setups
- Private Discord community
- ‘Buy The Dip’ signal alerts
- Exclusive members-only content
- Add-ons and resources
- 1 full year of unlimited support
Frequently Asked Questions
What is useThinkScript?
useThinkScript is the #1 community of stock market investors using indicators and other tools to power their trading strategies. Traders of all skill levels use our forums to learn about scripting and indicators, help each other, and discover new ways to gain an edge in the markets.
How do I get started?
We get it. Our forum can be intimidating, if not overwhelming. With thousands of topics, tens of thousands of posts, our community has created an incredibly deep knowledge base for stock traders. No one can ever exhaust every resource provided on our site.
If you are new, or just looking for guidance, here are some helpful links to get you started.
- The most viewed thread:
https://usethinkscript.com/threads/repainting-trend-reversal-for-thinkorswim.183/ - Our most popular indicator:
https://usethinkscript.com/threads/buy-the-dip-indicator-for-thinkorswim.3553/ - Answers to frequently asked questions:
https://usethinkscript.com/threads/answers-to-commonly-asked-questions.6006/
What are the benefits of VIP Membership?
VIP members get exclusive access to these proven and tested premium indicators: Buy the Dip, Advanced Market Moves 2.0, Take Profit, and Volatility Trading Range. In addition, VIP members get access to over 50 VIP-only custom indicators, add-ons, and strategies, private VIP-only forums, private Discord channel to discuss trades and strategies in real-time, customer support, trade alerts, and much more. Learn all about VIP membership here.
How can I access the premium indicators?
To access the premium indicators, which are plug and play ready, sign up for VIP membership here.