// This source code is subject to the terms of the Mozilla Public License 2.0 at https://mozilla.org/MPL/2.0/
// © LonesomeTheBlue
//
//@version=4
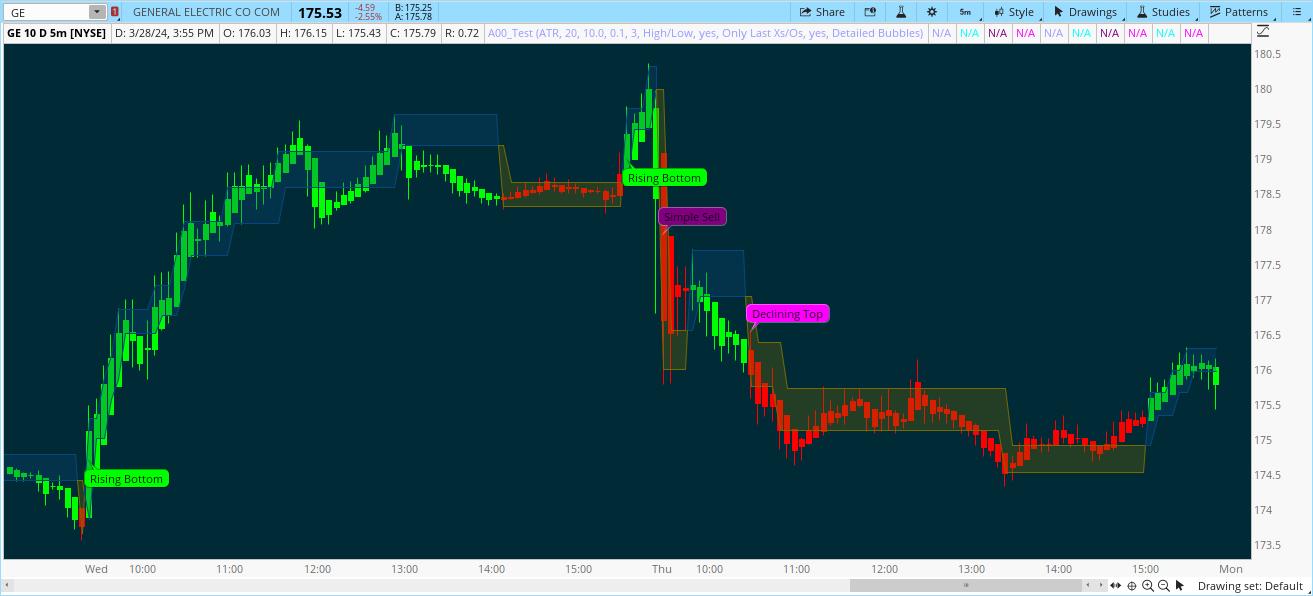
study("Point and Figure (PnF) Chart", overlay=true, max_bars_back=5000)
mode =input(title = "[PNF] Method", defval = 'ATR', options=['User Defined', 'ATR', 'Traditional', 'Percentage'])
modevalue = input(title ="[PNF] Atr Period", defval = 20, minval = 1)
boxsize = input(title ="[PNF] Box Size", defval = 10.0, minval = 0.000000000000001)
percentagebs = input(title ="[PNF] Percentage %", defval = 0.1, minval = 0.00001)
reversal = input(3, title = "[PNF] Reversal", minval = 1)
source =input(defval = "hl", title = "[PNF] Source", options=['close', 'hl'])
showpnfstyle =input(title = "[PNF] Chart Style As", defval = 'Area', options=['Candle', 'Area', 'Dont Show'])
pnfchartstyle =input(title = "[PNF] X/O Column Style", defval = 'Only Last Xs/Os', options=['From Beginning of Column', 'Only Last Xs/Os'])
breakoutcolor = input(defval = 'Lime/Red', title = "[DISPLAY] Color Theme", options =['Green/Red', 'Yellow/Blue', 'White/Yellow', 'Orange/Blue', 'Lime/Red', 'Blue/Red'])
changebarcol = input(true, title = "[DISPLAY] Change Bar Colors")
showbreakout = input(true, title = "[DISPLAY] Show Breakouts")
showecctarget = input(false, title = "[TARGET] Show Horizontal Count Targets")
maxnumhc = 20 //input(title ="[TARGET] Max columns for HC", defval=20, minval = 10, maxval = 50)
showvertarget = input(false, title = "[TARGET] Show Vertical Count Targets")
//traditional box size calculation
tboxsize = high < 0.25 ? 0.0625 :
high < 1.00 ? 0.125 :
high < 5.00 ? 0.25 :
high < 20.0 ? 0.50 :
high < 100.0 ? 1.0 :
high < 200.0 ? 2.0 :
high < 500.0 ? 4.0 :
high < 1000.0 ? 5.0 :
high < 25000.0 ? 50.0 :
500.0 //(high >= 25000.0)
//calc atr val
conv_atr(valu)=>
a = 0
num = syminfo.mintick
s = valu
if na(s)
s := syminfo.mintick
if num < 1
for i = 1 to 20
num := num * 10
if num > 1
break
a := a +1
for x = 1 to a
s := s * 10
s := round(s)
for x = 1 to a
s := s / 10
s := s < syminfo.mintick ? syminfo.mintick : s
s
//ATR box size calculation
atrboxsize = conv_atr(atr(modevalue))
//percentage box size calculation
pboxsize = conv_atr(percentagebs * close / 100)
float box = na
box := na(box[1]) ? mode == 'ATR' ? atrboxsize : mode == 'Traditional' ? tboxsize : mode == 'Percentage' ? pboxsize : boxsize : box[1]
top = 0.0, bottom = 0.0
trend = 0
trend := barstate.isfirst ? 0 : nz(trend[1])
currentprice = 0.0
currentprice := source == 'close' ? close : trend == 1 ? high : low
float beginprice = na
beginprice := barstate.isfirst ? floor(open / box) * box : nz(beginprice[1])
iopenprice = 0.0
icloseprice = 0.0
if trend == 0 and box * reversal <= abs(beginprice - currentprice)
if beginprice > currentprice
numcell = floor(abs(beginprice - currentprice) / box)
iopenprice := beginprice
icloseprice := beginprice - numcell * box
trend := -1
if beginprice < currentprice
numcell = floor(abs(beginprice - currentprice) / box)
iopenprice := beginprice
icloseprice := beginprice + numcell * box
trend := 1
if trend == -1
nok = true
if beginprice > currentprice and box <= abs(beginprice - currentprice)
numcell = floor(abs(beginprice - currentprice) / box)
icloseprice := beginprice - numcell * box
trend := -1
beginprice := icloseprice
nok := false
else
iopenprice := iopenprice == 0 ? nz(iopenprice[1]) : iopenprice
icloseprice := icloseprice == 0 ? nz(icloseprice[1]) : icloseprice
tempcurrentprice = source == 'close' ? close : high
if beginprice < tempcurrentprice and box * reversal <= abs(beginprice - tempcurrentprice) and nok //new column
numcell = floor(abs(beginprice - tempcurrentprice) / box)
iopenprice := beginprice + box
icloseprice := beginprice + numcell * box
trend := 1
beginprice := icloseprice
else
iopenprice := iopenprice == 0 ? nz(iopenprice[1]) : iopenprice
icloseprice := icloseprice == 0 ? nz(icloseprice[1]) : icloseprice
else
if trend == 1
nok = true
if beginprice < currentprice and box <= abs(beginprice - currentprice)
numcell = floor(abs(beginprice - currentprice) / box)
icloseprice := beginprice + numcell * box
trend := 1
beginprice := icloseprice
nok := false
else
iopenprice := iopenprice == 0 ? nz(iopenprice[1]) : iopenprice
icloseprice := icloseprice == 0 ? nz(icloseprice[1]) : icloseprice
tempcurrentprice = source == 'close' ? close : low
if beginprice > tempcurrentprice and box * reversal <= abs(beginprice - tempcurrentprice) and nok //new column
numcell = floor(abs(beginprice - tempcurrentprice) / box)
iopenprice := beginprice - box
icloseprice := beginprice - numcell * box
trend := -1
beginprice := icloseprice
else
iopenprice := iopenprice == 0 ? nz(iopenprice[1]) : iopenprice
icloseprice := icloseprice == 0 ? nz(icloseprice[1]) : icloseprice
//if icloseprice changed then recalculate box size
box := change(icloseprice) ? mode == 'ATR' ? atrboxsize : mode == 'Traditional' ? tboxsize : mode == 'Percentage' ? pboxsize : boxsize : box
upcolor = breakoutcolor == 'Green/Red' ? color.green : breakoutcolor == 'White/Yellow' ? color.white : breakoutcolor == 'Lime/Red' ? color.lime : breakoutcolor == 'Blue/Red' ? color.blue : breakoutcolor == 'Yellow/Blue' ? color.yellow : color.orange
downcolor = breakoutcolor == 'Yellow/Blue' or breakoutcolor == 'Orange/Blue' ? color.blue : breakoutcolor == 'Green/Red' or breakoutcolor == 'Lime/Red' or breakoutcolor == 'Blue/Red'? color.red : color.yellow
oprice = pnfchartstyle == 'From Beginning of Column' ? iopenprice :
trend == 1 ? nz(trend[1]) == 1 ? nz(icloseprice[1]) - nz(box[1]) : nz(icloseprice[1]) + nz(box[1]) :
trend == -1 ? nz(trend[1]) == -1 ? nz(icloseprice[1]) + nz(box[1]) : nz(icloseprice[1]) - nz(box[1]) :
nz(icloseprice[1])
oprice := oprice < 0 ? 0 : oprice
openline = plot(showpnfstyle == 'Area' and oprice > 0? oprice : na, title = "PnF Open", color = oprice < 0 or oprice[1] < 0 ? na : color.gray, editable = false)
closeline = plot(showpnfstyle == 'Area' and icloseprice > 0 ? icloseprice : na, title = "PnF Close", color = icloseprice <= 0 or icloseprice[1] <= 0 ? na : color.gray, editable = false)
fill(openline, closeline, color = oprice <= 0 and icloseprice <=0 ? na : trend == 1 ? upcolor : downcolor, transp = 70, editable = false)
plotcandle(showpnfstyle == 'Candle' ? oprice : na, showpnfstyle == 'Candle' ? max(oprice, icloseprice) : na, showpnfstyle == 'Candle' ? min(oprice , icloseprice) : na, showpnfstyle == 'Candle'? icloseprice : na, title='PnF Candles', color = trend == 1 ? upcolor : downcolor, editable = false)
barcolor(changebarcol ? trend == 1 ? upcolor : downcolor : na, editable = false)
//keep last close/open price
float lasticloseprice = na
lasticloseprice := change(icloseprice) ? icloseprice[1] : nz(lasticloseprice[1])
// keep old columns
float chigh = na
float clow = na
ctrend = 0
chigh := change(trend) ? max(iopenprice[1], icloseprice[1]) : na
clow := change(trend) ? min(iopenprice[1], icloseprice[1]) : na
ctrend := change(trend) ? trend[1] : na
// Breakouts and Target calculation
iscatapultup()=>
_ret = valuewhen(chigh, chigh, 3) == valuewhen(chigh, chigh, 5) and valuewhen(chigh, chigh, 1) > valuewhen(chigh, chigh, 3) and valuewhen(chigh, chigh, 1) <= valuewhen(chigh, chigh, 3) + 3 * box and valuewhen(clow, clow, 0) >= valuewhen(clow, clow, 2)
iscatapultdown()=>
_ret = valuewhen(clow, clow, 3) == valuewhen(clow, clow, 5) and valuewhen(clow, clow, 1) < valuewhen(clow, clow, 3) and valuewhen(clow, clow, 1) >= valuewhen(clow, clow, 3) - 3 * box and valuewhen(chigh, chigh, 0) <= valuewhen(chigh, chigh, 2)
doubletopbreakout()=>
_ret = trend == 1 and icloseprice > icloseprice[1] and icloseprice > valuewhen(chigh, chigh, 1) and icloseprice[1] <= valuewhen(chigh, chigh, 1)
doubletopbreakoutrisingbottom()=>
_ret = valuewhen(clow, clow, 0) > valuewhen(clow, clow, 2)
doublebottombreakout()=>
_ret = trend == -1 and icloseprice < icloseprice[1] and icloseprice < valuewhen(clow, clow, 1) and icloseprice[1] >= valuewhen(clow, clow, 1)
doubletopbreakoutdecliningtop()=>
_ret = valuewhen(chigh, chigh, 0) < valuewhen(chigh, chigh, 2)
tribletopbreakout()=>
_ret = trend == 1 and icloseprice > icloseprice[1] and icloseprice > valuewhen(chigh, chigh, 1) and icloseprice[1] <= valuewhen(chigh, chigh, 1) and valuewhen(chigh, chigh, 1) == valuewhen(chigh, chigh, 3)
tripletopbreakoutascending()=>
_ret = trend == 1 and icloseprice > icloseprice[1] and icloseprice > valuewhen(chigh, chigh, 1) and icloseprice[1] <= valuewhen(chigh, chigh, 1) and valuewhen(chigh, chigh, 1) == valuewhen(chigh, chigh, 3) + box
triblebottombreakout()=>
_ret = trend == -1 and icloseprice < icloseprice[1] and icloseprice < valuewhen(clow, clow, 1) and icloseprice[1] >= valuewhen(clow, clow, 1) and valuewhen(clow, clow, 1) == valuewhen(clow, clow, 3)
triplebottombreakoutdescending()=>
_ret = trend == -1 and icloseprice < icloseprice[1] and icloseprice < valuewhen(clow, clow, 1) and icloseprice[1] >= valuewhen(clow, clow, 1) and valuewhen(clow, clow, 1) == valuewhen(clow, clow, 3) - box
// Extended Congestions // horizontal count / Cohen
excontop = 0
exconlow = iopenprice // Congestion low point
indh = 1
if icloseprice > icloseprice[1] // is there move to up ?
float hi = icloseprice[1] // resistance level
float lo = iopenprice // lowest point of congestion to calculate target
notfirsthi = false
for x = 0 to 3000
if not na(chigh[x])
indh := indh + 1
if indh > maxnumhc // arrived to column limit
break
if chigh[x] >= hi and ctrend[x] == trend // new and higher resistance in history? / and chigh[x] < icloseprice and ctrend[x] == trend
hi := chigh[x] // keep new resistance
notfirsthi := true // resistance
if chigh[x] >= icloseprice // higher block?
if hi < icloseprice and notfirsthi and ctrend[x] == -trend // reached Os columnd and there is resistance point in congestion area
excontop := indh // keep it
exconlow := lo // keep lowestpoint for target calculation
break // don't look back more
lo := min(clow[x], lo) // taking lowest point of congestion
exconbot = 0
exconhigh = icloseprice // Congestion high point
indl = 1
if icloseprice < icloseprice[1] // is there move to down ?
float lo = icloseprice[1] // support level
float hi = iopenprice // highest point of congestion to calculate target
notfirstlo = false
for x = 0 to 3000
if not na(clow[x])
indl := indl + 1 // new block of Xs or Os
if indl > maxnumhc // arrived to column limit
break
if clow[x] <= lo and ctrend[x] == trend // new and lower support in history?
lo := clow[x] // keep new support level
notfirstlo := true // support
if clow[x] <= icloseprice // lower block?
if lo > icloseprice and notfirstlo and ctrend[x] == -trend // reached Os column and there is resistance point in congestion area
exconbot := indl // keep it
exconhigh := hi // keep highestpoint for target calculation
break // don't look back more
hi := max(chigh[x], hi) // taking higest point of congestion
ttb = tribletopbreakout()
ttbas = tripletopbreakoutascending()
tbb = triblebottombreakout()
tbbdes = triplebottombreakoutdescending()
dtb = doubletopbreakout()
dtbrb = dtb and doubletopbreakoutrisingbottom()
dbb = doublebottombreakout()
dbbdt = dbb and doubletopbreakoutdecliningtop()
// Extended congestion target calculation - horizontal count
float ecctarget = na
ecctarget := excontop >= 7 ? exconlow + reversal * excontop * box : exconbot >= 7 ? exconhigh - reversal * exconbot * box : ecctarget[1]
ecctarget := ecctarget > 0 ? ecctarget : ecctarget[1]
secctarget = false
valid = 0
valid := excontop >= 7 ? 1 : exconbot >= 7 ? 2 : nz(valid[1])
float keepbase = na
keepbase := excontop >= 7 ? exconlow : exconbot >= 7 ? exconhigh : nz(keepbase[1])
secctarget := excontop >= 7 or exconbot >= 7 ? true : secctarget[1]
secctarget := excontop >= 7 and ecctarget <= icloseprice ? false : exconbot >= 7 and ecctarget >= icloseprice ? false : secctarget
secctarget := ecctarget <= max(iopenprice, icloseprice) and ecctarget >= min(iopenprice, icloseprice) ? false : secctarget
secctarget := valid == 1 and icloseprice < keepbase ? false : valid == 2 and icloseprice > keepbase ? false : secctarget // target is cancelled if price goes outside of the bases -Jeremmy Du Plessis
ecccol = ecctarget > max(iopenprice, icloseprice) ? color.blue : color.red
ecctarget := not secctarget ? na : ecctarget
plot(showecctarget ? ecctarget : na, title = "ECC Target", linewidth = 3, color = secctarget and secctarget[1] and ecctarget == nz(ecctarget[1]) ? ecccol : na, style = plot.style_linebr, editable = false)
// Vertical top/bottom target calculation, this works for triple top/bottom breakouts
float ddtarget = na, float dbase1 = na, float dbase2 = na
dbase1 := min(valuewhen(clow, clow,0), valuewhen(clow, clow,2))
dbase2 := max(valuewhen(chigh, chigh,0), valuewhen(chigh, chigh,2))
ddtarget := ttb or ttbas ? dbase1 + (icloseprice - iopenprice) * reversal : tbb or tbbdes ? dbase2 - (iopenprice - icloseprice) * reversal : ddtarget[1]
ddtarget := ddtarget > 0 ? ddtarget : ddtarget[1]
// vertical count should be calculated until column is completed
ddkeepcountup = false, ddkeepcountdown = false
ddkeepcountup := ttb or ttbas ? true : change(trend) !=0 ? false : ddkeepcountup[1]
ddkeepcountdown := tbb or tbbdes ? true : change(trend) !=0 ? false : ddkeepcountdown[1]
if ddkeepcountup or ddkeepcountdown
ddtarget := ddkeepcountup ? dbase1 + (icloseprice - iopenprice) * reversal : ddkeepcountdown ? dbase2 - (iopenprice - icloseprice) * reversal : ddtarget[1]
ddtarget := ddtarget > 0 ? ddtarget : ddtarget[1]
sddtarget = false
dvalid = 0
dvalid := ttb or ttbas ? 1 : tbb or tbbdes ? 2 : nz(dvalid[1])
float dkeepbase = na
dkeepbase := ttb or ttbas ? dbase1 : tbb or tbbdes ? dbase2 : nz(dkeepbase[1])
sddtarget := ttb or ttbas or tbb or tbbdes ? true : sddtarget[1]
sddtarget := (ttb or ttbas) and ddtarget <= icloseprice ? false : (tbb or tbbdes) and ddtarget >= icloseprice ? false : sddtarget
sddtarget := ddtarget <= max(iopenprice, icloseprice) and ddtarget >= min(iopenprice, icloseprice) ? false : sddtarget
sddtarget := dvalid == 1 and icloseprice < dkeepbase ? false : dvalid == 2 and icloseprice > dkeepbase ? false : sddtarget // target is cancelled if price goes outside of the bases -Jeremmy Du Plessis
ddcol = ddtarget > max(iopenprice, icloseprice) ? color.maroon : color.olive
ddtarget := not sddtarget ? na : ddtarget
plot(showvertarget ? ddtarget : na, title = "Vertical Count Target", linewidth = 3, color = sddtarget and sddtarget[1] ? ddcol : na, style = plot.style_linebr, editable = false)
if excontop >= 7 and showecctarget
label.new(bar_index, y = ecctarget, text = 'Target' + tostring(ecctarget, '#.#####'), color = color.lime, textcolor=color.black, style=label.style_labelup, yloc=yloc.price)
if exconbot >= 7 and showecctarget
label.new(bar_index, y = ecctarget, text = 'Target' + tostring(ecctarget, '#.#####'), color = color.maroon, textcolor=color.white, style=label.style_labeldown, yloc=yloc.price)
boupcolor = color.green
bodncolor = color.red
plotshape(ttb and showbreakout, text = "Triple Top\n\n\n.", title='Triple Top', style=shape.triangleup, color=boupcolor, textcolor=boupcolor, size = size.tiny, location=location.abovebar, transp=0, editable = false)
plotshape(ttbas and showbreakout, text = "Triple Top\nAscending\n\n.", title='Ascending Triple Top', style=shape.triangleup, color=boupcolor, textcolor=boupcolor, size = size.tiny, location=location.abovebar, transp=0, editable = false)
plotshape(tbb and showbreakout, text = ".\n\nTriple Bottom", title='Triple Bottom', style=shape.triangledown, color=bodncolor, textcolor=bodncolor, size = size.tiny, location=location.belowbar, transp=0, editable = false)
plotshape(tbbdes and showbreakout, text = ".\n\nTriple Bottom\nDescending", title='Descending Triple Bottom', style=shape.triangledown, color=bodncolor, textcolor=bodncolor, size = size.tiny, location=location.belowbar, transp=0, editable = false)
plotshape(dtb and not dtbrb and showbreakout, text = "Simple Buy\n.", title='Simple Buy', style=shape.triangleup, color=boupcolor, textcolor=boupcolor, size = size.tiny, location=location.abovebar, transp=0, editable = false)
plotshape(dtbrb and showbreakout, text = "Simple Buy With\nRising Bottom", title='Simple Buy with Rising Bottom', style=shape.triangleup, color=boupcolor, textcolor=boupcolor, size = size.tiny, location=location.abovebar, transp=0, editable = false)
plotshape(dbb and not dbbdt and showbreakout, text = "Simple Sell", title='Simple Sell', style=shape.triangledown, color=bodncolor, textcolor=bodncolor, size = size.tiny, location=location.belowbar, transp=0, editable = false)
plotshape(dbbdt and showbreakout, text = "Simple Sell With\nDeclining Top", title='Simple Sell with Declining Top', style=shape.triangledown, color=bodncolor, textcolor=bodncolor, size = size.tiny, location=location.belowbar, transp=0, editable = false)
plotshape(dtb and iscatapultup() and showbreakout, text = "Catapult\n\n\n\n.", title='Catapult', style=shape.triangleup, color=boupcolor, textcolor=boupcolor, size = size.tiny, location=location.abovebar, transp=0, editable = false)
plotshape(dbb and iscatapultdown() and showbreakout, text = ".\n\n\n\nCatapult", title='Catapult', style=shape.triangledown, color=bodncolor, textcolor=bodncolor, size = size.tiny, location=location.belowbar, transp=0, editable = false)
alertcondition(change(trend) > 0, title='PNF Trend is Up', message='PNF Trend is Up')
alertcondition(change(trend) < 0, title='PNF Trend is Down', message='PNF Trend is Down')