
Pocket pivots were originally designed by Chris Kacher to combat sideways market. Back then it was difficult to trade base breakouts and often always a failure. The concept of Pocket Pivots came out of this. It allows traders to get an early entry on the stock before it breaks out of its base.
Developer Scott Johnson was able to take this concept and created a Pocket Pivot indicator for ThinkorSwim users. He wrote a lot of notes in his script and most of them are important points to note. I had to take it out and quote it here instead. Scott, if you're reading this I have no intention of messing with your code or trying to modify it.


Additional Resources:
I added a scanner into that indicator just in case anyone would like to scan for Pocket Pivot on their charts.
Developer Scott Johnson was able to take this concept and created a Pocket Pivot indicator for ThinkorSwim users. He wrote a lot of notes in his script and most of them are important points to note. I had to take it out and quote it here instead. Scott, if you're reading this I have no intention of messing with your code or trying to modify it.
Identifies up-day volume spikes that may be a buyable pocket pivot. Based on the work of Gil Morales and Chris Kacher.
http://www.wiley.com/WileyCDA/WileyTitle/productCd-0470616539,miniSiteCd-WILEYTRADING.htmlhttp://www.wiley.com/WileyCDA/WileyTitle/productCd-1118273028,miniSiteCd-WILEYTRADING.htmlhttp://www.aaiilosangeles.org/SkirballPresentations/Morales&Kacher091110.pdf
This study checks price and volume to see if they met the pocket pivot criteria. The other criteria (strong fundamentals, no wedging, constructive basing, etc.) need to be evaluated separately. I made these additions/modifications to Gil's and Chris's vague and sometimes conflicting definition of a pocket pivot:
- Per Gil and Chris, the volume on the day of the pocket pivot must be higher than any down day in the previous 10 days. But if the volume is "choppy", then increase the period to 11 to 15 days. But they don't define "choppy". For the purposes of this script, I define choppy when the standard deviation of the volume is > 125% of the average. Update: I removed the stddev logic since it didn't eliminate any obviously poor pivots. I'm always looking at the volume on the previous 10 days.
- I only count the pocket pivot if the stock closes in the upper 62% of the day's price range. Up days that close lower in the range are considered stalling.
- Gil and Chris say daily price closes prior to the pivot should be "tight" without any specifics. I defined tight as where the average percent price change at close over the last 10 days is <= 1.5%. Update: I removed this rule after backtesting against Gil's examples.
- Gil and Chris have examples of pocket pivots off of the 50-day instead of the 10-day. At that point the stock is extended from the 10-day. That seems to conflict with the idea that a pocket pivot occurs after a quiet period in the stock so I have not implemented rules for 50-day PPs here.
- The low on the day of the pivot must be within 1.4% of the 10-day SMA or the price must have moved up through the 10-day during that day. Several of Gil/Chris's examples conflict. (Example: 1.24 in one example is described as too extended, but there are others where 1.6 or even 2.5% above the 10-day SMA isn't too extended. In the Trading Cockpit with the O'Neil Disciples, Chapter 5.) I'm choosing to use a middle and slightly conservative setting here. The more extended, the more risky the buy.
- Pocket pivots should not be bought when then stock is below the 50- or 200-day simple moving averages. I check only the 50-day here because when I checked the 200-day, TOS was hiding the study for recent IPOs with less than 200 days of price history.
thinkScript Code
Rich (BB code):
# Copyright 2015 Scott J. Johnson (http://scottjjohnson.com)
input Period = 11; # normal volume lookback period (today + 10 prior days)
input MaximumDistanceFrom10DaySMAPercent = 1.4; # Price on pivot day should be near the 10-day SMA. MAX = 1.6 Per FOSL1, 1.23 per PII, but RAX not extended at 1.61 and 1.64.
# Volume functions
def DownVolume = If(close < close[1], volume, 0);
def HighestDownVolume = Highest(DownVolume, Period);
def FiftyDayAverageVolume = MovingAverage(AverageType.SIMPLE, volume, 50);
def IsVolumeGreaterHighestDownVolume = if (volume > HighestDownVolume) then 1 else 0;
# Price functions
def TenDaySMA = MovingAverage(AverageType.SIMPLE, close, 10);
def FiftyDaySMA = MovingAverage(AverageType.SIMPLE, close, 50);
def IsLowPriceNear10DaySMA = if ((AbsValue(low - TenDaySMA) / TenDaySMA) <= MaximumDistanceFrom10DaySMAPercent / 100) then 1 else 0;
def DidPricePass10DaySMA = if (low <= TenDaySMA && close >= TenDaySMA) then 1 else 0;
def IsPriceNear10DaySMA = if (IsLowPriceNear10DaySMA or DidPricePass10DaySMA) then 1 else 0;
def IsPriceAtOrAbove50DaySMA = if (close >= FiftyDaySMA) then 1 else 0;
def AveragePriceChangePercent = MovingAverage(AverageType.SIMPLE, AbsValue(close[1] - close[2]) / close[2], Period);
def IsCloseInUpperHalfOfRange = close >= close[1] && close > ((high - low) * .38 + low);
def IsPriceInTheProperRange = if (IsCloseInUpperHalfOfRange && IsPriceNear10DaySMA && IsPriceAtOrAbove50DaySMA) then 1 else 0;
# add a chart bubble if then PP criteria are met
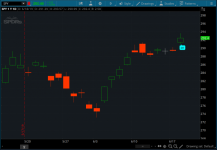
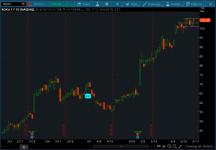
AddChartBubble(IsVolumeGreaterHighestDownVolume && IsPriceInTheProperRange, low, "PP", Color.CYAN, no);
#Scan
def PParrow = IsVolumeGreaterHighestDownVolume and IsPriceInTheProperRange;
plot PP = PParrow;
PP.SetPaintingStrategy(PaintingStrategy.BOOLEAN_ARROW_UP);
PP.SetLineWeight(2);
PP.AssignValueColor(Color.WHITE);Shareable Link
https://tos.mx/os8HkiPocket Pivot Long Strategy
Code:
# Copyright 2015 Scott J. Johnson (http://scottjjohnson.com)
# Licensed under the Apache License, Version 2.0
# PocketPivotStrategyLE
# Identifies Pocket Pivot buy points.  This is a copy of the PocketPivot study.
# Unfortunately I have to copy the entire logic here rather than just referencing
# the study.  See PocketPivotSTUDY.ts for a description of the study.

declare hide_on_intraday;

input Period = 11;  # normal volume lookback period (today + 10 prior days)
input MaximumDistanceFrom10DaySMAPercent = 1.4;  # Price on pivot day should be near the 10-day SMA.  MAX = 1.6 Per FOSL1, 1.23 per PII, but RAX not extended at 1.61 and 1.64.

# Volume functions
def DownVolume = If(close < close[1], volume, 0);
def HighestDownVolume = Highest(DownVolume, Period);

def FiftyDayAverageVolume = MovingAverage(AverageType.SIMPLE, volume, 50);

def IsVolumeGreaterHighestDownVolume = if (volume > HighestDownVolume) then 1 else 0;

# Price functions
def TenDaySMA = MovingAverage(AverageType.SIMPLE, close, 10);
def FiftyDaySMA = MovingAverage(AverageType.SIMPLE, close, 50);

def IsLowPriceNear10DaySMA = if ((AbsValue(low - TenDaySMA) / TenDaySMA) <= MaximumDistanceFrom10DaySMAPercent / 100) then 1 else 0;
def DidPricePass10DaySMA = if (low <= TenDaySMA && close >= TenDaySMA) then 1 else 0;

def IsPriceNear10DaySMA = if (IsLowPriceNear10DaySMA or DidPricePass10DaySMA) then 1 else 0;

def IsPriceAtOrAbove50DaySMA = if (close >= FiftyDaySMA) then 1 else 0;

def AveragePriceChangePercent = MovingAverage(AverageType.SIMPLE, AbsValue(close[1] - close[2]) / close[2], Period);

def IsCloseInUpperHalfOfRange = close >= close[1] && close > ((high - low) * .38 + low);

def IsPriceInTheProperRange = if (IsCloseInUpperHalfOfRange && IsPriceNear10DaySMA && IsPriceAtOrAbove50DaySMA) then 1 else 0;

# add a chart bubble if then PP criteria are met
# AddChartBubble(IsVolumeGreaterHighestDownVolume && IsPriceInTheProperRange, low, "PP", Color.CYAN, no);

# add a chart bubble if then PP criteria are met
def buy = if (IsVolumeGreaterHighestDownVolume && IsPriceInTheProperRange) then 1 else 0;

AddOrder(OrderType.BUY_TO_OPEN, buy equals 1, tickColor = GetColor(0), arrowColor = GetColor(0), price = close, name = "Buy");
Pocket Pivot Short Strategy
Code:
# Copyright 2015 Scott J. Johnson (http://scottjjohnson.com). Licensed under the Apache License, Version 2.0
# PocketPivotStrategyLX
# Sell when we break the 10/50 day line on day 1 and then go below that day's intraday
# low on a subsequent day.  Also sell if we break the 50-day on volume more than 40%
# above average.

input MovingAverageLine = 50; # sell when violates 50 day SMA
input HighVolumePercentage = 40; # if volume is greater or equal that this percentage
                                 # above the 50-day average volume then it counts
                                 # as a high volume day.

def TodaysSMA = MovingAverage(AverageType.SIMPLE, close[1], MovingAverageLine);
def YesterdaysSMA = MovingAverage(AverageType.SIMPLE, close[1], MovingAverageLine);

# volume rule always uses the 50-day, but the SMA violation run can be 10- or 50-day
def Todays50DaySMA = MovingAverage(AverageType.SIMPLE, close[1], 50);
def AverageVolume = MovingAverage(AverageType.SIMPLE, volume[1], 50);

def DidViolateSMA = if (low < low[1] && close[1] < YesterdaysSMA) then 1 else 0;
def DidBreakSMAOnHighVolume = if (close<Todays50DaySMA && volume > AverageVolume * (1 + HighVolumePercentage/100)) then 1 else 0;

def sell = if (DidViolateSMA or DidBreakSMAOnHighVolume) then 1 else 0;

AddOrder(OrderType.SELL_TO_CLOSE, sell equals 1, tickColor = GetColor(1), arrowColor = GetColor(1), price = low[1], name = "Sell");
Additional Resources:
I added a scanner into that indicator just in case anyone would like to scan for Pocket Pivot on their charts.
Attachments
Last edited:
")
 literally had the same code to place the bubble on volume study (just replacing low with volume) and was staring at the screen like where the hell is it. Well, turns out, i never moved this study to the volume section in the Studies & Strategies window....
 lol thanks again