Pocket Pivot Points Indicator and Scanner for ThinkorSwim

BenTen

Administrative
Staff member
Staff
VIP
Lifetime
Pocket pivots were originally designed by Chris Kacher to combat sideways market. Back then it was difficult to trade base breakouts and often always a failure. The concept of Pocket Pivots came out of this. It allows traders to get an early entry on the stock before it breaks out of its base.

Developer Scott Johnson was able to take this concept and created a Pocket Pivot indicator for ThinkorSwim users. He wrote a lot of notes in his script and most of them are important points to note. I had to take it out and quote it here instead. Scott, if you're reading this I have no intention of messing with your code or trying to modify it.

Identifies up-day volume spikes that may be a buyable pocket pivot. Based on the work of Gil Morales and Chris Kacher.

http://www.wiley.com/WileyCDA/WileyTitle/productCd-0470616539,miniSiteCd-WILEYTRADING.htmlhttp://www.wiley.com/WileyCDA/WileyTitle/productCd-1118273028,miniSiteCd-WILEYTRADING.htmlhttp://www.aaiilosangeles.org/SkirballPresentations/Morales&Kacher091110.pdf
This study checks price and volume to see if they met the pocket pivot criteria. The other criteria (strong fundamentals, no wedging, constructive basing, etc.) need to be evaluated separately. I made these additions/modifications to Gil's and Chris's vague and sometimes conflicting definition of a pocket pivot:

  1. Per Gil and Chris, the volume on the day of the pocket pivot must be higher than any down day in the previous 10 days. But if the volume is "choppy", then increase the period to 11 to 15 days. But they don't define "choppy". For the purposes of this script, I define choppy when the standard deviation of the volume is > 125% of the average. Update: I removed the stddev logic since it didn't eliminate any obviously poor pivots. I'm always looking at the volume on the previous 10 days.
  2. I only count the pocket pivot if the stock closes in the upper 62% of the day's price range. Up days that close lower in the range are considered stalling.
  3. Gil and Chris say daily price closes prior to the pivot should be "tight" without any specifics. I defined tight as where the average percent price change at close over the last 10 days is <= 1.5%. Update: I removed this rule after backtesting against Gil's examples.
  4. Gil and Chris have examples of pocket pivots off of the 50-day instead of the 10-day. At that point the stock is extended from the 10-day. That seems to conflict with the idea that a pocket pivot occurs after a quiet period in the stock so I have not implemented rules for 50-day PPs here.
  5. The low on the day of the pivot must be within 1.4% of the 10-day SMA or the price must have moved up through the 10-day during that day. Several of Gil/Chris's examples conflict. (Example: 1.24 in one example is described as too extended, but there are others where 1.6 or even 2.5% above the 10-day SMA isn't too extended. In the Trading Cockpit with the O'Neil Disciples, Chapter 5.) I'm choosing to use a middle and slightly conservative setting here. The more extended, the more risky the buy.
  6. Pocket pivots should not be bought when then stock is below the 50- or 200-day simple moving averages. I check only the 50-day here because when I checked the 200-day, TOS was hiding the study for recent IPOs with less than 200 days of price history.

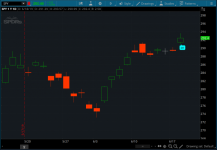
ecJootC.png


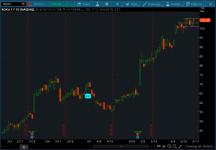
upr9IDV.png


thinkScript Code

Rich (BB code):
# Copyright 2015 Scott J. Johnson (http://scottjjohnson.com)
input Period = 11;  # normal volume lookback period (today + 10 prior days)
input MaximumDistanceFrom10DaySMAPercent = 1.4;  # Price on pivot day should be near the 10-day SMA.  MAX = 1.6 Per FOSL1, 1.23 per PII, but RAX not extended at 1.61 and 1.64.

# Volume functions
def DownVolume = If(close < close[1], volume, 0);
def HighestDownVolume = Highest(DownVolume, Period);

def FiftyDayAverageVolume = MovingAverage(AverageType.SIMPLE, volume, 50);

def IsVolumeGreaterHighestDownVolume = if (volume > HighestDownVolume) then 1 else 0;

# Price functions
def TenDaySMA = MovingAverage(AverageType.SIMPLE, close, 10);
def FiftyDaySMA = MovingAverage(AverageType.SIMPLE, close, 50);

def IsLowPriceNear10DaySMA = if ((AbsValue(low - TenDaySMA) / TenDaySMA) <= MaximumDistanceFrom10DaySMAPercent / 100) then 1 else 0;
def DidPricePass10DaySMA = if (low <= TenDaySMA && close >= TenDaySMA) then 1 else 0;

def IsPriceNear10DaySMA = if (IsLowPriceNear10DaySMA or DidPricePass10DaySMA) then 1 else 0;

def IsPriceAtOrAbove50DaySMA = if (close >= FiftyDaySMA) then 1 else 0;

def AveragePriceChangePercent = MovingAverage(AverageType.SIMPLE, AbsValue(close[1] - close[2]) / close[2], Period);

def IsCloseInUpperHalfOfRange = close >= close[1] && close > ((high - low) * .38 + low);

def IsPriceInTheProperRange = if (IsCloseInUpperHalfOfRange && IsPriceNear10DaySMA && IsPriceAtOrAbove50DaySMA) then 1 else 0;

# add a chart bubble if then PP criteria are met
AddChartBubble(IsVolumeGreaterHighestDownVolume && IsPriceInTheProperRange, low, "PP", Color.CYAN, no);

#Scan
def PParrow = IsVolumeGreaterHighestDownVolume and IsPriceInTheProperRange;
plot PP = PParrow;
PP.SetPaintingStrategy(PaintingStrategy.BOOLEAN_ARROW_UP);
PP.SetLineWeight(2);
PP.AssignValueColor(Color.WHITE);

Shareable Link

https://tos.mx/os8Hki

Pocket Pivot Long Strategy

Code:
# Copyright 2015 Scott J. Johnson (http://scottjjohnson.com)
# Licensed under the Apache License, Version 2.0
# PocketPivotStrategyLE
# Identifies Pocket Pivot buy points.  This is a copy of the PocketPivot study.
# Unfortunately I have to copy the entire logic here rather than just referencing
# the study.  See PocketPivotSTUDY.ts for a description of the study.

declare hide_on_intraday;

input Period = 11;  # normal volume lookback period (today + 10 prior days)
input MaximumDistanceFrom10DaySMAPercent = 1.4;  # Price on pivot day should be near the 10-day SMA.  MAX = 1.6 Per FOSL1, 1.23 per PII, but RAX not extended at 1.61 and 1.64.

# Volume functions
def DownVolume = If(close < close[1], volume, 0);
def HighestDownVolume = Highest(DownVolume, Period);

def FiftyDayAverageVolume = MovingAverage(AverageType.SIMPLE, volume, 50);

def IsVolumeGreaterHighestDownVolume = if (volume > HighestDownVolume) then 1 else 0;

# Price functions
def TenDaySMA = MovingAverage(AverageType.SIMPLE, close, 10);
def FiftyDaySMA = MovingAverage(AverageType.SIMPLE, close, 50);

def IsLowPriceNear10DaySMA = if ((AbsValue(low - TenDaySMA) / TenDaySMA) <= MaximumDistanceFrom10DaySMAPercent / 100) then 1 else 0;
def DidPricePass10DaySMA = if (low <= TenDaySMA && close >= TenDaySMA) then 1 else 0;

def IsPriceNear10DaySMA = if (IsLowPriceNear10DaySMA or DidPricePass10DaySMA) then 1 else 0;

def IsPriceAtOrAbove50DaySMA = if (close >= FiftyDaySMA) then 1 else 0;

def AveragePriceChangePercent = MovingAverage(AverageType.SIMPLE, AbsValue(close[1] - close[2]) / close[2], Period);

def IsCloseInUpperHalfOfRange = close >= close[1] && close > ((high - low) * .38 + low);

def IsPriceInTheProperRange = if (IsCloseInUpperHalfOfRange && IsPriceNear10DaySMA && IsPriceAtOrAbove50DaySMA) then 1 else 0;

# add a chart bubble if then PP criteria are met
# AddChartBubble(IsVolumeGreaterHighestDownVolume && IsPriceInTheProperRange, low, "PP", Color.CYAN, no);

# add a chart bubble if then PP criteria are met
def buy = if (IsVolumeGreaterHighestDownVolume && IsPriceInTheProperRange) then 1 else 0;

AddOrder(OrderType.BUY_TO_OPEN, buy equals 1, tickColor = GetColor(0), arrowColor = GetColor(0), price = close, name = "Buy");

Pocket Pivot Short Strategy

Code:
# Copyright 2015 Scott J. Johnson (http://scottjjohnson.com). Licensed under the Apache License, Version 2.0
# PocketPivotStrategyLX
# Sell when we break the 10/50 day line on day 1 and then go below that day's intraday
# low on a subsequent day.  Also sell if we break the 50-day on volume more than 40%
# above average.

input MovingAverageLine = 50; # sell when violates 50 day SMA
input HighVolumePercentage = 40; # if volume is greater or equal that this percentage
                                 # above the 50-day average volume then it counts
                                 # as a high volume day.

def TodaysSMA = MovingAverage(AverageType.SIMPLE, close[1], MovingAverageLine);
def YesterdaysSMA = MovingAverage(AverageType.SIMPLE, close[1], MovingAverageLine);

# volume rule always uses the 50-day, but the SMA violation run can be 10- or 50-day
def Todays50DaySMA = MovingAverage(AverageType.SIMPLE, close[1], 50);
def AverageVolume = MovingAverage(AverageType.SIMPLE, volume[1], 50);

def DidViolateSMA = if (low < low[1] && close[1] < YesterdaysSMA) then 1 else 0;
def DidBreakSMAOnHighVolume = if (close<Todays50DaySMA && volume > AverageVolume * (1 + HighVolumePercentage/100)) then 1 else 0;

def sell = if (DidViolateSMA or DidBreakSMAOnHighVolume) then 1 else 0;

AddOrder(OrderType.SELL_TO_CLOSE, sell equals 1, tickColor = GetColor(1), arrowColor = GetColor(1), price = low[1], name = "Sell");

Additional Resources:


I added a scanner into that indicator just in case anyone would like to scan for Pocket Pivot on their charts.
 

Attachments

  • ecJootC.png
    ecJootC.png
    326.8 KB · Views: 328
  • upr9IDV.png
    upr9IDV.png
    330 KB · Views: 346
Last edited:

Join useThinkScript to post your question to a community of 21,000+ developers and traders.

@BenTen It's always wise to listen to Kacher & Morales. They've written several books on it. Their website can be found via search MoKa Advisors, I beleive.

 
Last edited:
Hello Friends,

Could someone help me to give a think-script scanner for the below conditions?

If today's current price is greater than or less than (Previous day high + Previous day low + previous Day close ) / 3
 
What about the days before the previous day? Should they be above or below the HLC/3?? Or do you literally want just the previous day greater than HLC3?
 
Hello @BenTen Thank you for making this thinkScript code! Is there anyway you can help me come up with the code to have think or swim give me an audible alert and message in the message center when a stock gives a pocket pivot on a daily chart? Basically just a notification that it happened. I could be wrong, but I think its called a Boolean plot that would show where the pocket pivot condition is fulfilled. Thank you!
 
Last edited:
You have three different scripts. Are they meant to be three different scanners or three different studies? I was able to turn the first script into a scanner and it produced a ton of results.
 
So I gather that pocket pivot is a LONG only strategy. But in visually testing it on SPY or QQQ, it doesn't seem to work that well as the stock often goes down after a PP signal. Question is where to place stops and when to exit? Any thoughts from anyone?

You should read their book. Pocket pivot is essentially a concept they created when they realized that many more breakouts have failed on a post QE environment. Pocket pivots are a way to buy deeper in a base before a breakout.

If what Im saying to you doesnt make sense then start with Bill Oneils how to make money in stocks and then read Gil Morales and Chris Kachers first book.

Pocket pivots are still discretionary and you shouldnt just buy because one is triggered. The stock also needs to be building a correct base and show strong growth fundamentals. I often use pocket pivots as a signal to initiate a small position if all other criteria is met. If the stock then breaks out ill add the rest of.my position size, but its a way to let me keep my average cost down

Also, you should only use pocket pivots on individual stocks, not etfs.
Thanks for sharing, how does it work so far?
 
Hi @BenTen

May I ask if you can recheck the code for the chart cause the bubble is not showing up. The scan works fine, but not the one on the chart indicator.

I remember having the original code by Scott it's just that I can't find it among my old stuff. I'm teaching a kid how to identify PP's it's just that it's faster to visually identify them in hundreds of charts than waiting for the scan.

Thanks in advanced.
 
Found the original code that's working. I previously modified the 10sma to 8ema.
Not sure what's wrong with @BenTen code above; curious what's the difference.
Anyhow, below should work.

Code:
# Copyright 2015 Scott J. Johnson (http://scottjjohnson.com)
# Fast range changed from 10sma to 8ema; NeoEon

input Period = 11;  # normal volume lookback period (today + 10 prior days)
input MaximumDistanceFrom10DaySMAPercent = 1.4;  # Price on pivot day should be near the 10-day SMA.  MAX = 1.6 Per FOSL1, 1.23 per PII, but RAX not extended at 1.61 and 1.64.

# Volume functions
def DownVolume = If(close < close[1], volume, 0);
def HighestDownVolume = Highest(DownVolume, Period);

def FiftyDayAverageVolume = MovingAverage(AverageType.SIMPLE, volume, 50);

def IsVolumeGreaterHighestDownVolume = if (volume > HighestDownVolume) then 1 else 0;

# Price functions
def TenDaySMA = MovingAverage(AverageType.EXPONENTIAL, close, 8);
def FiftyDaySMA = MovingAverage(AverageType.SIMPLE, close, 50);

def IsLowPriceNear10DaySMA = if ((AbsValue(low - TenDaySMA) / TenDaySMA) <= MaximumDistanceFrom10DaySMAPercent / 100) then 1 else 0;
def DidPricePass10DaySMA = if (low <= TenDaySMA && close >= TenDaySMA) then 1 else 0;

def IsPriceNear10DaySMA = if (IsLowPriceNear10DaySMA or DidPricePass10DaySMA) then 1 else 0;

def IsPriceAtOrAbove50DaySMA = if (close >= FiftyDaySMA) then 1 else 0;

def AveragePriceChangePercent = MovingAverage(AverageType.SIMPLE, AbsValue(close[1] - close[2]) / close[2], Period);

def IsCloseInUpperHalfOfRange = close >= close[1] && close > ((high - low) * .38 + low);

def IsPriceInTheProperRange = if (IsCloseInUpperHalfOfRange && IsPriceNear10DaySMA && IsPriceAtOrAbove50DaySMA) then 1 else 0;

# add a chart bubble if then PP criteria are met
AddChartBubble(IsVolumeGreaterHighestDownVolume && IsPriceInTheProperRange, low, "PP", Color.CYAN, no);

#Scan
def PParrow = IsVolumeGreaterHighestDownVolume and IsPriceInTheProperRange;
plot PP = PParrow;
PP.SetPaintingStrategy(PaintingStrategy.BOOLEAN_ARROW_UP);
PP.SetLineWeight(2);
PP.AssignValueColor(Color.WHITE);
 
Hello, I found an awesome script (all credit to @BenTen based on Scott J. Johnson's work)
https://usethinkscript.com/threads/pocket-pivot-points-indicator-and-scanner-for-thinkorswim.242/
for placing chart bubbles which indicate pocket pivots. I was wondering how in the world do I place these bubbles on the top of the volume bars instead of the price bars. It's super annoying to have these on price bars as it looks really cluttered. I have been at it for a couple hours but I keep failing. Please help, thanks!
This is the script @BenTen made:
Code:
# Copyright 2015 Scott J. Johnson (http://scottjjohnson.com)

input Period = 11;  # normal volume lookback period (today + 10 prior days)

input MaximumDistanceFrom10DaySMAPercent = 1.4;  # Price on pivot day should be near the 10-day SMA.  MAX = 1.6 Per FOSL1, 1.23 per PII, but RAX not extended at 1.61 and 1.64.


# Volume functions

def DownVolume = If(close < close[1], volume, 0);

def HighestDownVolume = Highest(DownVolume, Period);


def FiftyDayAverageVolume = MovingAverage(AverageType.SIMPLE, volume, 50);


def IsVolumeGreaterHighestDownVolume = if (volume > HighestDownVolume) then 1 else 0;


# Price functions

def TenDaySMA = MovingAverage(AverageType.SIMPLE, close, 10);

def FiftyDaySMA = MovingAverage(AverageType.SIMPLE, close, 50);


def IsLowPriceNear10DaySMA = if ((AbsValue(low - TenDaySMA) / TenDaySMA) <= MaximumDistanceFrom10DaySMAPercent / 100) then 1 else 0;

def DidPricePass10DaySMA = if (low <= TenDaySMA && close >= TenDaySMA) then 1 else 0;


def IsPriceNear10DaySMA = if (IsLowPriceNear10DaySMA or DidPricePass10DaySMA) then 1 else 0;


def IsPriceAtOrAbove50DaySMA = if (close >= FiftyDaySMA) then 1 else 0;


def AveragePriceChangePercent = MovingAverage(AverageType.SIMPLE, AbsValue(close[1] - close[2]) / close[2], Period);


def IsCloseInUpperHalfOfRange = close >= close[1] && close > ((high - low) * .38 + low);


def IsPriceInTheProperRange = if (IsCloseInUpperHalfOfRange && IsPriceNear10DaySMA && IsPriceAtOrAbove50DaySMA) then 1 else 0;


# add a chart bubble if then PP criteria are met

AddChartBubble(IsVolumeGreaterHighestDownVolume && IsPriceInTheProperRange, low, "PP", Color.CYAN, no);


#Scan

def PParrow = IsVolumeGreaterHighestDownVolume and IsPriceInTheProperRange;

plot PP = PParrow;

PP.SetPaintingStrategy(PaintingStrategy.BOOLEAN_ARROW_UP);

PP.SetLineWeight(2);

PP.AssignValueColor(Color.WHITE);


a3xoVXs.png
 
Last edited by a moderator:
Hello, I found an awesome script (all credit to @BenTen based on Scott J. Johnson's work)
https://usethinkscript.com/threads/pocket-pivot-points-indicator-and-scanner-for-thinkorswim.242/
for placing chart bubbles which indicate pocket pivots. I was wondering how in the world do I place these bubbles on the top of the volume bars instead of the price bars. It's super annoying to have these on price bars as it looks really cluttered. I have been at it for a couple hours but I keep failing. Please help, thanks!
This is the script @BenTen made:
Code:
# Copyright 2015 Scott J. Johnson (http://scottjjohnson.com)

input Period = 11;  # normal volume lookback period (today + 10 prior days)

input MaximumDistanceFrom10DaySMAPercent = 1.4;  # Price on pivot day should be near the 10-day SMA.  MAX = 1.6 Per FOSL1, 1.23 per PII, but RAX not extended at 1.61 and 1.64.


# Volume functions

def DownVolume = If(close < close[1], volume, 0);

def HighestDownVolume = Highest(DownVolume, Period);


def FiftyDayAverageVolume = MovingAverage(AverageType.SIMPLE, volume, 50);


def IsVolumeGreaterHighestDownVolume = if (volume > HighestDownVolume) then 1 else 0;


# Price functions

def TenDaySMA = MovingAverage(AverageType.SIMPLE, close, 10);

def FiftyDaySMA = MovingAverage(AverageType.SIMPLE, close, 50);


def IsLowPriceNear10DaySMA = if ((AbsValue(low - TenDaySMA) / TenDaySMA) <= MaximumDistanceFrom10DaySMAPercent / 100) then 1 else 0;

def DidPricePass10DaySMA = if (low <= TenDaySMA && close >= TenDaySMA) then 1 else 0;


def IsPriceNear10DaySMA = if (IsLowPriceNear10DaySMA or DidPricePass10DaySMA) then 1 else 0;


def IsPriceAtOrAbove50DaySMA = if (close >= FiftyDaySMA) then 1 else 0;


def AveragePriceChangePercent = MovingAverage(AverageType.SIMPLE, AbsValue(close[1] - close[2]) / close[2], Period);


def IsCloseInUpperHalfOfRange = close >= close[1] && close > ((high - low) * .38 + low);


def IsPriceInTheProperRange = if (IsCloseInUpperHalfOfRange && IsPriceNear10DaySMA && IsPriceAtOrAbove50DaySMA) then 1 else 0;


# add a chart bubble if then PP criteria are met

AddChartBubble(IsVolumeGreaterHighestDownVolume && IsPriceInTheProperRange, low, "PP", Color.CYAN, no);


#Scan

def PParrow = IsVolumeGreaterHighestDownVolume and IsPriceInTheProperRange;

plot PP = PParrow;

PP.SetPaintingStrategy(PaintingStrategy.BOOLEAN_ARROW_UP);

PP.SetLineWeight(2);

PP.AssignValueColor(Color.WHITE);

what if the bubbles were farther away from the candles, will that be good enough? Add a multiplication factor to the vertical position to move it lower.

AddChartBubble(IsVolumeGreaterHighestDownVolume && IsPriceInTheProperRange, ( low * 0.993 ), "PP", Color.CYAN, no);

-------------

a study in one environment, can't draw shapes in another.

i suggest leaving the original study as is, and making 2 copies of it, to be modified.
one for the upper chart, disable the bubble code line.
one for volume, disable the arrow.
disable a code line by adding # at the beginning of it.


bubble code for volume study

AddChartBubble(IsVolumeGreaterHighestDownVolume && IsPriceInTheProperRange, volume, "PP", Color.CYAN, yes);
 
Last edited by a moderator:
wow thank you for that @halcyonguy I am new at this so I wont kick myself too much but I think i made a rookie mistake 😂 literally had the same code to place the bubble on volume study (just replacing low with volume) and was staring at the screen like where the hell is it. Well, turns out, i never moved this study to the volume section in the Studies & Strategies window....👨‍🦯 lol thanks again
 

Similar threads

Not the exact question you're looking for?

Start a new thread and receive assistance from our community.

87k+ Posts
295 Online
Create Post

Similar threads

Similar threads

The Market Trading Game Changer

Join 2,500+ subscribers inside the useThinkScript VIP Membership Club
  • Exclusive indicators
  • Proven strategies & setups
  • Private Discord community
  • ‘Buy The Dip’ signal alerts
  • Exclusive members-only content
  • Add-ons and resources
  • 1 full year of unlimited support

Frequently Asked Questions

What is useThinkScript?

useThinkScript is the #1 community of stock market investors using indicators and other tools to power their trading strategies. Traders of all skill levels use our forums to learn about scripting and indicators, help each other, and discover new ways to gain an edge in the markets.

How do I get started?

We get it. Our forum can be intimidating, if not overwhelming. With thousands of topics, tens of thousands of posts, our community has created an incredibly deep knowledge base for stock traders. No one can ever exhaust every resource provided on our site.

If you are new, or just looking for guidance, here are some helpful links to get you started.

What are the benefits of VIP Membership?
VIP members get exclusive access to these proven and tested premium indicators: Buy the Dip, Advanced Market Moves 2.0, Take Profit, and Volatility Trading Range. In addition, VIP members get access to over 50 VIP-only custom indicators, add-ons, and strategies, private VIP-only forums, private Discord channel to discuss trades and strategies in real-time, customer support, trade alerts, and much more. Learn all about VIP membership here.
How can I access the premium indicators?
To access the premium indicators, which are plug and play ready, sign up for VIP membership here.
Back
Top