several things,
when asking questions to strangers, assume they don't know what you are talking about, and describe the issue thoroughly.
some people can look at the code, and make some guesses, but they shouldn't have to.
you wrote 6 words describing it, which leaves us guessing at what you really want.
. plot top and bottom 25% range,
plot what? lines? , arrows?
plot where ?
25% range of what ?
-----------------------
when an agg time is used in a formula, it over rules individual bar data.
this RPR formula uses the price value only from the first bar of each day, and draws a horizontal line for each day.
it doesn't use price from each bar.
def RPR = (Round((price – low(period = AggregationPeriod.DAY)) / (high(period = AggregationPeriod.DAY) – low(period = AggregationPeriod.DAY)) * 100))/4;
sometimes this works, sometimes it doesn't.
separate the agg values , then reference their variables in another formula, it will read price from each bar.
input price = close;
def lo = low(period = AggregationPeriod.DAY);
def hi = high(period = AggregationPeriod.DAY);
def RPR = (Round((price – lo) / (hi – lo) * 100))/4;
i ended up writing fold loops to find the highest and lowest for each day.
-----------------------
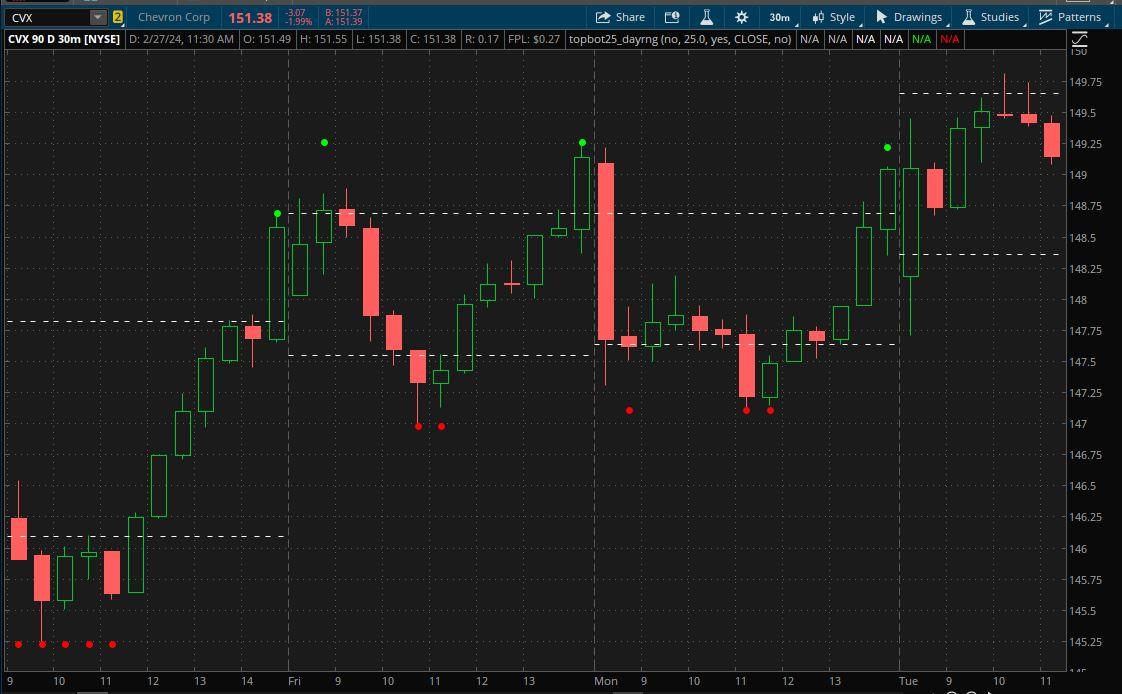
my guess at something you want
this draws lines at the % levels , 25 and 75.
if close is higher than highest or lower than lowest, then it draws a dot
Code:
#topbot25_dayrng

#https://usethinkscript.com/threads/plot-top-and-bottom-25-range.18049/
#Plot Top and Bottom 25% Range
#PAYtience  2/24

#I want to plot top and bottom 25% range, if someone can help me with the code.


def na = double.nan;

def d = getday();
def n = 800;
def big = 99999;

# run a loop on 1st bar of day, to find highest and lowest
def hi;
def lo;
if d != d[1] then {
 hi = fold e1 = 0 to n
 with p1 = 0
 while d == getvalue(d, -e1)
 do max(p1, getvalue(high, -e1));
 lo = fold e2 = 0 to n
 with p2 = big
 while d == getvalue(d, -e2)
 do min(p2, getvalue(low, -e2));
} else {
 hi = hi[1];
 lo = lo[1];
}

input show_daily_high_low_lines = no;
plot zhi = if show_daily_high_low_lines then hi else na;
plot zlo = if show_daily_high_low_lines then lo else na;
zhi.setdefaultcolor(color.light_gray);
zlo.setdefaultcolor(color.light_gray);
zhi.SetPaintingStrategy(PaintingStrategy.HORIZONTAL);
zlo.SetPaintingStrategy(PaintingStrategy.HORIZONTAL);

input range_percent = 25.0;
def hiperlevel = (hi - (range_percent/100 * (hi-lo)));
def loperlevel = (lo + (range_percent/100 * (hi-lo)));

input show_percent_lines = yes;
plot phi = if show_percent_lines then hiperlevel else na;
plot plo = if show_percent_lines then loperlevel else na;
phi.SetPaintingStrategy(PaintingStrategy.HORIZONTAL);
plo.SetPaintingStrategy(PaintingStrategy.HORIZONTAL);
phi.setdefaultcolor(color.white);
plo.setdefaultcolor(color.white);
phi.SetStyle(Curve.short_DASH);
plo.SetStyle(Curve.short_DASH);

input price = close;
def hix = if price >= hiperlevel then hi else 0;
plot zhix = if hix > 0 then hix else na;
zhix.SetPaintingStrategy(PaintingStrategy.POINTS);
zhix.SetDefaultColor(Color.green);
zhix.setlineweight(4);
zhix.hidebubble();
plot lox = if price <= loperlevel then lo else na;
lox.SetPaintingStrategy(PaintingStrategy.POINTS);
lox.SetDefaultColor(Color.red);
lox.setlineweight(4);
lox.hidebubble();

#-------------------------------

input test2_bub = no;
addchartbubble(test2_bub, low,
price + "\n" +
#hi + " hi\n" +
hiperlevel + "\n" +
loperlevel + "\n" +
#lo + " lo\n" +
#(hi – lo) + " diff\n" +
#((price – lo)/(hi – lo)*100) + " %\n" +
#rpr + " RPR\n"
hix + "\n" +
zhix + "\n" +
lox + "\n" +
(price >= hiperlevel)
, color.yellow, no);
#
dashed lines , at % levels , 25 and 75.
dots when close goes beyond a line
CVX 30min