#supp_resis_levels_fib
#https://usethinkscript.com/threads/plot-support-resistance-levels-based-on-inputs.20557/
#Plot Support & Resistance Levels based on inputs
#rava feb 15, 2025
#I need an study that will allow me to input values for support, resistance and fib levels which i will be performing with various time over the weekend. Following the same i will key in the values to the following weeks trade. the study should allow me to enter values manually based on the analysis.
#--------------------------
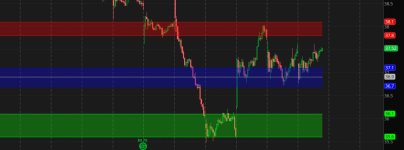
# if the chart is showing 1 of the 10 picked stocks, lines will be drawn
# enter a stock and 4 price levels, for support and resistance
# enter up to 10 stock parameters
# the mid level range will be calc'd from the supp and resis levels
def na = double.nan;
def bn = barnumber();
#def lastbarbn = HighestAll(If(IsNaN(close), 0, bn));
#def lastbar = if (bn == lastbarbn) then 1 else 0;
def lastbar = !isnan(close[0]) and isnan(close[-1]);
def data = close;
# with invalid stock symbols, this section doesn't work
input stock01 = "DOW";
input support01_a = 35.6;
input support01_b = 36.1;
input resistance01_a = 37.8;
input resistance01_b = 38.1;
input stock02 = "T";
input support02_a = 25.9;
input support02_b = 26.06;
input resistance02_a = 27.0;
input resistance02_b = 27.15;
input stock03 = "ZZZ";
input support03_a = 0.0;
input support03_b = 0.0;
input resistance03_a = 0.0;
input resistance03_b = 0.0;
input stock04 = "ZZZ";
input support04_a = 0.0;
input support04_b = 0.0;
input resistance04_a = 0.0;
input resistance04_b = 0.0;
input stock05 = "ZZZ";
input support05_a = 0.0;
input support05_b = 0.0;
input resistance05_a = 0.0;
input resistance05_b = 0.0;
input stock06 = "ZZZ";
input support06_a = 0.0;
input support06_b = 0.0;
input resistance06_a = 0.0;
input resistance06_b = 0.0;
input stock07 = "ZZZ";
input support07_a = 0.0;
input support07_b = 0.0;
input resistance07_a = 0.0;
input resistance07_b = 0.0;
input stock08 = "ZZZ";
input support08_a = 0.0;
input support08_b = 0.0;
input resistance08_a = 0.0;
input resistance08_b = 0.0;
input stock09 = "ZZZ";
input support09_a = 0.0;
input support09_b = 0.0;
input resistance09_a = 0.0;
input resistance09_b = 0.0;
input stock10 = "ZZZ";
input support10_a = 0.0;
input support10_b = 0.0;
input resistance10_a = 0.0;
input resistance10_b = 0.0;
#-------------------------
#def stk;
def s1;
def s2;
def r1;
def r2;
if GetSymbol() == stock01 and !isnan(close(stock01)) and support01_a > 0 then {
# stk = close(stock01);
s1 = support01_a;
s2 = support01_b;
r1 = resistance01_a;
r2 = resistance01_b;
} else if GetSymbol() == stock02 and !isnan(close(stock02)) and support02_a > 0 then {
# stk = close(stock02);
s1 = support02_a;
s2 = support02_b;
r1 = resistance02_a;
r2 = resistance02_b;
} else if GetSymbol() == stock03 and !isnan(close(stock03)) and support03_a > 0 then {
# stk = close(stock03);
s1 = support03_a;
s2 = support03_b;
r1 = resistance03_a;
r2 = resistance03_b;
} else if GetSymbol() == stock04 and !isnan(close(stock04)) and support04_a > 0 then {
# stk = close(stock04);
s1 = support04_a;
s2 = support04_b;
r1 = resistance04_a;
r2 = resistance04_b;
} else if GetSymbol() == stock05 and !isnan(close(stock05)) and support05_a > 0 then {
# stk = close(stock05);
s1 = support05_a;
s2 = support05_b;
r1 = resistance05_a;
r2 = resistance05_b;
} else if GetSymbol() == stock06 and !isnan(close(stock06)) and support06_a > 0 then {
# stk = close(stock06);
s1 = support06_a;
s2 = support06_b;
r1 = resistance06_a;
r2 = resistance06_b;
} else if GetSymbol() == stock07 and !isnan(close(stock07)) and support07_a > 0 then {
# stk = close(stock07);
s1 = support07_a;
s2 = support07_b;
r1 = resistance07_a;
r2 = resistance07_b;
} else if GetSymbol() == stock08 and !isnan(close(stock08)) and support08_a > 0 then {
# stk = close(stock08);
s1 = support08_a;
s2 = support08_b;
r1 = resistance08_a;
r2 = resistance08_b;
} else if GetSymbol() == stock09 and !isnan(close(stock09)) and support09_a > 0 then {
# stk = close(stock09);
s1 = support09_a;
s2 = support09_b;
r1 = resistance09_a;
r2 = resistance09_b;
} else if GetSymbol() == stock10 and !isnan(close(stock10)) and support10_a > 0 then {
# stk = close(stock10);
s1 = support10_a;
s2 = support10_b;
r1 = resistance10_a;
r2 = resistance10_b;
} else {
# stk = 0;
s1 = 0;
s2 = 0;
r1 = 0;
r2 = 0;
}
#--------------------------
addlabel((s1==0), " This stock does not have parameters set ", color.cyan);
addlabel((s1==0)," ", color.black);
addlabel((s1==0),
"list of stocks: " +
(if !isnan(close(stock01)) and support01_a > 0 then stock01 + ", " else "") +
(if !isnan(close(stock02)) and support02_a > 0 then stock02 + ", " else "") +
(if !isnan(close(stock03)) and support03_a > 0 then stock03 + ", " else "") +
(if !isnan(close(stock04)) and support04_a > 0 then stock04 + ", " else "") +
(if !isnan(close(stock05)) and support05_a > 0 then stock05 + ", " else "") +
(if !isnan(close(stock06)) and support06_a > 0 then stock06 + ", " else "") +
(if !isnan(close(stock07)) and support07_a > 0 then stock07 + ", " else "") +
(if !isnan(close(stock08)) and support08_a > 0 then stock08 + ", " else "") +
(if !isnan(close(stock09)) and support09_a > 0 then stock09 + ", " else "") +
(if !isnan(close(stock10)) and support10_a > 0 then stock10 + ", " else "")
,color.cyan);
# plot 2 support lines & 2 resis lines
plot zs1 = if s1 > 0 then s1 else na;
plot zs2 = if s2 > 0 then s2 else na;
plot zr1 = if r1 > 0 then r1 else na;
plot zr2 = if r2 > 0 then r2 else na;
zs1.setdefaultcolor(color.green);
zs2.setdefaultcolor(color.green);
zr1.setdefaultcolor(color.red);
zr2.setdefaultcolor(color.red);
addcloud(zs1,zs2,color.green,color.green);
addcloud(zr1,zr2,color.red,color.red);
# calc mid level, based on avg of supp and resis ranges
def avgrng = (absvalue(zs1-zs2) + absvalue(zr1-zr2))/2;
def smid = (zs1+zs2)/2;
def rmid = (zr1+zr2)/2;
def mid = (smid+rmid)/2;
def mid1 = mid - (avgrng/2);
def mid2 = mid + (avgrng/2);
plot zmid = mid;
zmid.setdefaultcolor(color.light_gray);
plot zmid1 = mid1;
plot zmid2 = mid2;
zmid1.setdefaultcolor(color.blue);
zmid2.setdefaultcolor(color.blue);
addcloud(zmid1,zmid2,color.blue,color.blue);
#--------------------------------
addchartbubble(0, low,
GetSymbol() + "\n" +
stock01 + "\n" +
!isnan(close(stock01)) + "\n" +
support01_a + "\n" +
(GetSymbol() == stock01 and !isnan(close(stock01)) and support01_a > 0)
, color.yellow, no);
addchartbubble(0, low*0.992,
#stk + "\n" +
s1 + "\n" +
s2 + "\n" +
r1 + "\n" +
r2 + "\n"
, color.CYAN, no);
addchartbubble(0, low*0.992,
#stk + "\n" +
zs1 + "\n" +
zs2 + "\n" +
zr1 + "\n" +
zr2 + "\n"
, color.yellow, no);
#