Plot Premarket Open Trendline / Range

nicktrader

New member
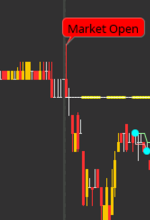
Looking for the correct TOS code to plot a trendline for the opening price based on premarket data (candle) starting at 4AM EST (0400). I have some code to plot the line, but Im having trouble with just plotting it for the current day only (not any prior days). I know my code is probably all messed up.. but it gives an idea.

Code:
input openingPMTime  = 0400.0; #hint OrMeanS: Begin Mean Period. Usually Market Open EST.
input openingTime  = 0930.0; #hint OrMeanS: Begin Mean Period. Usually Market Open EST.

def isDaily = If (GetAggregationPeriod() == AggregationPeriod.DAY, yes, no);
def isToday = If (GetDay() == GetLastDay() and SecondsFromTime(openingPMTime) >= 0, yes, no);
def isPreMarket = If (GetDay() == GetLastDay() and SecondsTillTime(openingPMTime) < 0, yes, no);

input pricePMOpen = open;

rec time_value = if(SecondsTillTime(openingPMTime) == 0, pricePMOpen, time_value[1]);

plot plotPMOpenLine = if(time_value == 0 and isToday, double.nan, time_value);
     plotPMOpenLine.SetDefaultColor(color.yellow);


Any assistance would be greatly appreciated. Thank You!! @BenTen
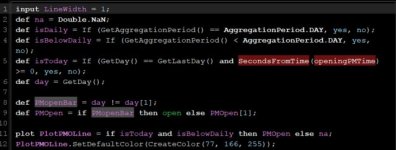
 
An answer from The Universe of ThinkScript in Tutorial Section...

@nicktrader Try to work with this - Full script to work with at bottom.:D

Code:
15:01 Mobius©: Time Bracket: Objective, get first bar of RTH

def FirstBar = if SecondsFromTime(0930) == 0 and
                  SecondsTillTime(0930) == 0
                  then get barNumber()
                  else FirstBar[1];

15:10 Krafty: Mobius - I can understand how that code would work on a chart, where the code is called repeatedly, but I still don't understand how something like barNumber() would work in a scan that only calls it once. Would I put that in a script and use parameters for the brackets?

15:13 Mobius©: Krafty - a scan is a one pass event but the bar numbers are still there. The limitations are different in the scanner. As long as you don't try to go to far back it works exactly like the charts do. If you make it a dynamic scan it updates about every 3 minutes

Example below:

[ATTACH=full]4903[/ATTACH]

def na = double.nan;
def condition = if SecondsFromTime(0930) == 0 && SecondsTillTime(0930) == 0
                            then barNumber()
                            else na;
def StartBar = condition;
def StartBarOpen =  if barNumber() == StartBar
                                    then open
                                    else StartBarOpen[1];
def timecondition = if !isnan(startBarOpen)
                                    then startbarOpen
                                    else na;
addchartbubble(timecondition,HIGH,"Market Open");
 

Attachments

  • abNQa4B.png
    abNQa4B.png
    33.8 KB · Views: 142
Last edited:
Or use this from the Universe of ThinkScript:

Code:
AddVerticalLine(SecondsTillTime(1130) == 0,
               "Lunch",
                Color.Cyan,
                Curve.Short_Dash);
 
Ok thank you, @markos Ill gave it a try. i must have missed something from your first post. I can see the chart bubble, but not sure how to make it so there is a plot (or trendline) that displays on the chart from the opening premarket price and only visible on "today's" timeframe. I've done this for other S&R lines where it displays previous day's H&L and only displays for today and any time frame below Daily. However, Im having such a hard time with getting this to work with premarket data and the entire "time" functions within TOS.
 
@nicktrader There is a veritable boat load of scripts and examples in the Tutorial Section: Universe of Thinkscript. You could spend a week there and not read it all! JohnnyQuotron is the curator of that huge reference. Come back if you're stuck after a while, someone will direct you further.
Be sure you have code to post so we can see what you're looking at.
 
@nicktrader Modified from a different study finding an open. Not sure it works and not tested but maybe you can work it into your study. If lucky it will work.

def day = GetDay();

def PMopenBar = day != day[1];

def PMOpen = if PMopenBar then open else PMOpen[1];

plot PMO = PMOpen ;

PMO.SetDefaultColor (CreateColor (234, 136, 255));
 
Thank you both very much, @horserider , @markos !! I got it working, below is the full code with all the variables I used. Thanks again for all your help.

Code:
input LineWidth = 1;
def na = Double.NaN;
def isDaily = If (GetAggregationPeriod() == AggregationPeriod.DAY, yes, no);
def isBelowDaily = If (GetAggregationPeriod() < AggregationPeriod.DAY, yes, no);
def isToday = If (GetDay() == GetLastDay() and SecondsFromTime(openingPMTime) >= 0, yes, no);
def day = GetDay();

def PMopenBar = day != day[1];
def PMOpen = if PMopenBar then open else PMOpen[1];

plot PlotPMOLine = if isToday and isBelowDaily then PMOpen else na;
     PlotPMOLine.SetDefaultColor(CreateColor(77, 166, 255));
     PlotPMOLine.SetLineWeight(LineWidth);
     PlotPMOLine.SetPaintingStrategy(PaintingStrategy.DASHES);
     PlotPMOLine.HideTitle();
     PlotPMOLine.HideBubble();
 
As @horserider asked, please share a picture of how it looks. We all benefit and learn when we see the end result!
You had it practically done. Great job filling in the missing pieces. 🥳👏👍

Both of you, please feel free to jump in and answer a few questions as you see them, your help would be appreciated.
 
nXKvcUgl.jpg


@nicktrader three little things if you would please:
please send the share of your code and a full picture of your chart so we can see how it is used.
Also, to keep track of code "ownership", try to get in the habit of putting the following in your scripts:
# AD Label
# Mobius
# Chat Room Request 04.26.2016 or uTS Request or whatever.
# v 7-19 just to keep track of what, who, and when. BTW, put this symbol on your chart and it will keep track of the A/D for the day.

input SYMB = "$ADSPD";

def Data = close(symbol = "$ADSPD", period = AggregationPeriod.Day);
addLabel(1, "AD = " + Data, if Data < 0
then color.red
else color.green);
# End Code
 

Attachments

  • nXKvcUgl.jpg
    nXKvcUgl.jpg
    31.4 KB · Views: 115
Last edited by a moderator:
@markos This should be the full code. I believe a few lines were left off what nicktrader copied as the working study.


Code:
input openingPMTime  = 0400.0; #hint OrMeanS: Begin Mean Period. Usually Market Open EST.
input openingTime  = 0930.0; #hint OrMeanS: Begin Mean Period. Usually Market Open EST.

def isDaily = If (GetAggregationPeriod() == AggregationPeriod.DAY, yes, no);

def isPreMarket = If (GetDay() == GetLastDay() and SecondsTillTime(openingPMTime) < 0, yes, no);
input LineWidth = 1;
def na = Double.NaN;

def isBelowDaily = If (GetAggregationPeriod() < AggregationPeriod.DAY, yes, no);
def isToday = If (GetDay() == GetLastDay() and SecondsFromTime(openingPMTime) >= 0, yes, no);
def day = GetDay();

def PMopenBar = day != day[1];
def PMOpen = if PMopenBar then open else PMOpen[1];

plot PlotPMOLine = if isToday and isBelowDaily then PMOpen else na;
     PlotPMOLine.SetDefaultColor(CreateColor(77, 166, 255));
     PlotPMOLine.SetLineWeight(LineWidth);
     PlotPMOLine.SetPaintingStrategy(PaintingStrategy.DASHES);
     PlotPMOLine.HideTitle();
     PlotPMOLine.HideBubble();
 
Ok no problem, @markos Updated code is below: (sorry I typed it all up and never posted, my bad!);

# Plot Premarket Open price on your TOS chart
# Plot will only show for the current day and will only be displayed on timeframe < Daily
#
# Owner: Nick Trader
# Date: 2019.07.19
#
#

input LineWidth = 1;
input openingPMTime = 0400.0; #Begin Premarket Opening Period. EST.
input openingTime = 0930.0; #Begin Regular market Opening Period. EST.

def na = Double.NaN;
def day = GetDay();
def isDaily = If (GetAggregationPeriod() == AggregationPeriod.DAY, yes, no);
def isBelowDaily = If (GetAggregationPeriod() < AggregationPeriod.DAY, yes, no);
def isToday = If (day == GetLastDay() and SecondsFromTime(openingPMTime) >= 0, yes, no);

def PMopenBar = day != day[1];
def PMOpen = if PMopenBar then open else PMOpen[1];

plot PlotPMOLine = if isToday and isBelowDaily then PMOpen else na;
PlotPMOLine.SetDefaultColor(CreateColor(77, 166, 255));
PlotPMOLine.SetLineWeight(LineWidth);
PlotPMOLine.SetPaintingStrategy(PaintingStrategy.DASHES);
PlotPMOLine.HideTitle();
PlotPMOLine.HideBubble();


# End Code
 
Ok no problem, @markos Updated code is below: (sorry I typed it all up and never posted, my bad!);

# Plot Premarket Open price on your TOS chart
# Plot will only show for the current day and will only be displayed on timeframe < Daily
#
# Owner: Nick Trader
# Date: 2019.07.19
#


# End Code
@nicktrader Thank you for following up, I appreciate that. Also, thanks for putting a proper header in. Now we all know were it originated from when it gets spread on the net,
If you don't oppose, Put created by vs Owner or just name and where you created/shared it. #Nick Trade in uTS or TSL, etc.
 
Sorry no problem. here is the updated code with the reference and both creators listed.

# Plot Premarket Open price on your TOS chart
# Plot will only show for the current day and will only be displayed on timeframe < Daily
#
# Created by: NickTrader & HorseRider via uTS
# Date: 2019.07.19
#
#

input LineWidth = 1;
input openingPMTime = 0400.0; #Begin Premarket Opening Period. EST.
input openingTime = 0930.0; #Begin Regular market Opening Period. EST.

def na = Double.NaN;
def day = GetDay();
def isDaily = If (GetAggregationPeriod() == AggregationPeriod.DAY, yes, no);
def isBelowDaily = If (GetAggregationPeriod() < AggregationPeriod.DAY, yes, no);
def isToday = If (day == GetLastDay() and SecondsFromTime(openingPMTime) >= 0, yes, no);

def PMopenBar = day != day[1];
def PMOpen = if PMopenBar then open else PMOpen[1];

plot PlotPMOLine = if isToday and isBelowDaily then PMOpen else na;
PlotPMOLine.SetDefaultColor(CreateColor(77, 166, 255));
PlotPMOLine.SetLineWeight(LineWidth);
PlotPMOLine.SetPaintingStrategy(PaintingStrategy.DASHES);
PlotPMOLine.HideTitle();
PlotPMOLine.HideBubble();


# End Code
 
@nicktrader hahaha Thanks. My evil sense of humor gets the best of me at times after what markos posted. Hope it will help with your trading. I am guessing a move above or below premarket open may give a hint to how the stock will move that day. Is that the idea?
 
lol @horserider . no worries buddy. I appreciate the assistance with the script. I hope it will help too. TC2000 posts this automatically in the software and I was looking to start using TOS as the cost of the platform and data fees are just a bit too much for me to renew. TOS is good, but its such a system hog. And yes, that is the idea with the line plot. it can be used to set sentiment or bias. thx again for your help and I may ping you in the near future as I have a few more "ideas" im working on. :)
 
@markos @nicktrader Lets play at making money. nicktrader Glad to assist with any ideas when I can. You can adjust the amount of memory allocated to ToS at log in screen. Also had big trouble of ToS messing with my old computer (AMD Athlon2 or such) until I changed quote times to "Slow max delay 10 sec" . Not a problem since. Setup, Application settings, System is where it hides.
 

Join useThinkScript to post your question to a community of 21,000+ developers and traders.

Similar threads

Not the exact question you're looking for?

Start a new thread and receive assistance from our community.

87k+ Posts
550 Online
Create Post

Similar threads

Similar threads

The Market Trading Game Changer

Join 2,500+ subscribers inside the useThinkScript VIP Membership Club
  • Exclusive indicators
  • Proven strategies & setups
  • Private Discord community
  • ‘Buy The Dip’ signal alerts
  • Exclusive members-only content
  • Add-ons and resources
  • 1 full year of unlimited support

Frequently Asked Questions

What is useThinkScript?

useThinkScript is the #1 community of stock market investors using indicators and other tools to power their trading strategies. Traders of all skill levels use our forums to learn about scripting and indicators, help each other, and discover new ways to gain an edge in the markets.

How do I get started?

We get it. Our forum can be intimidating, if not overwhelming. With thousands of topics, tens of thousands of posts, our community has created an incredibly deep knowledge base for stock traders. No one can ever exhaust every resource provided on our site.

If you are new, or just looking for guidance, here are some helpful links to get you started.

What are the benefits of VIP Membership?
VIP members get exclusive access to these proven and tested premium indicators: Buy the Dip, Advanced Market Moves 2.0, Take Profit, and Volatility Trading Range. In addition, VIP members get access to over 50 VIP-only custom indicators, add-ons, and strategies, private VIP-only forums, private Discord channel to discuss trades and strategies in real-time, customer support, trade alerts, and much more. Learn all about VIP membership here.
How can I access the premium indicators?
To access the premium indicators, which are plug and play ready, sign up for VIP membership here.
Back
Top