Hi,
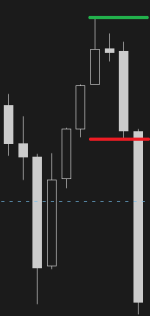
I am trying to plot a line at the high and low values of the previous three 15m bars. Rather than continuous lines, I'd like the line to extend back only to the first of the three lookback bars (as shown in the image below).
I've been trying to modify the "count" code in this post for a 15m period but I've been unable to extend it longer than one bar. I've also tried implementing "BarNumber()" but haven't wrapped my head around it. Any help would be appreciated.

Here is the code so far, which creates continuous lines:
I am trying to plot a line at the high and low values of the previous three 15m bars. Rather than continuous lines, I'd like the line to extend back only to the first of the three lookback bars (as shown in the image below).
I've been trying to modify the "count" code in this post for a 15m period but I've been unable to extend it longer than one bar. I've also tried implementing "BarNumber()" but haven't wrapped my head around it. Any help would be appreciated.
Here is the code so far, which creates continuous lines:
Code:
input NumberOfBarsPast = 3;
input AggPeriod = AggregationPeriod.FIFTEEN_MIN;
def l = low(period = AggPeriod);
def h = high(period = AggPeriod);
def LowestBar = Lowest(l, NumberOfBarsPast);
def HighestBar = Highest(h, NumberOfBarsPast);

plot LowLine = LowestBar;
LowLine.SetDefaultColor(Color.DARK_RED);
plot HighLine = HighestBar;
HighLine.SetDefaultColor(Color.DARK_GREEN);
Last edited: