#
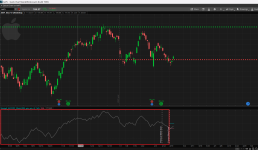
# Accumulation_Distribution_Divergence
# Assembled by Kory Gill (@korygill) for BenTen at usethinkscript.com
# Added Previous Week H/L
declare lower;
declare once_per_bar;
input OpenTime = 0930;
def bn = BarNumber();
def nan = Double.NaN;
def sft = SecondsFromTime(OpenTime);
def data = if close > close[1] then close - Min(close[1], low) else if close < close[1] then close - Max(close[1], high) else 0;
def SumData = if bn == 1 then data else SumData[1] + data;
def ADBP = SumData;
def hVal;
def lVal;
if bn == 1
then
{
hVal = nan;
lVal = nan;
}
else if bn == 2
then
{
hVal = ADBP;
lVal = ADBP;
}
else
{
if sft == 0
then
{
hVal = ADBP;
lVal = ADBP;
}
else
{
hVal = Max(hVal[1], ADBP);
lVal = Min(lVal[1], ADBP);
}
}
def pdh = if sft[-1] == 0 then hVal else pdh[1];
def pdl = if sft[-1] == 0 then lVal else pdl[1];
plot ppdh = pdh;
plot ppdl = pdl;
ppdh.SetPaintingStrategy(PaintingStrategy.HORIZONTAL);
ppdl.SetPaintingStrategy(PaintingStrategy.HORIZONTAL);
ppdh.SetDefaultColor(GetColor(1));
ppdl.SetDefaultColor(GetColor(0));
#Previous Week High/Low
#Weeks Defined
def ymd = GetWeek();
def count = if ymd != ymd[1] and !IsNaN(close) then count[1] + 1 else count[1];
def cond = HighestAll(count) - count + 1;
input vertical = yes;
AddVerticalLine(vertical and cond[1] == 3 and cond == 2, "Prevous Week Start", Color.WHITE);
AddVerticalLine(vertical and cond[1] == 2 and cond == 1, "Current Week Start", Color.WHITE);
def pwh =
if cond[1] == 3 and cond == 2 then pdh
else if cond == 2 and sft[0] == 0 and pdh > pwh[1] then pdh
else if cond == 1 then pwh[1]
else pwh[1];
plot ppwh = if cond > 1 then Double.NaN else pwh;
ppwh.SetPaintingStrategy(PaintingStrategy.HORIZONTAL);
def pwl =
if cond[1] == 3 and cond == 2 then pdl
else if cond == 2 and sft[0] == 0 and pdl < pwl[1] then pdl
else if cond == 1 then pwl[1]
else pwl[1];
plot ppwl = if cond > 1 then Double.NaN else pwl;
ppwl.SetPaintingStrategy(PaintingStrategy.HORIZONTAL);
input bubbles = yes;
input bubblemover = 2;
def mover = bubbles and IsNaN(close[bubblemover]) and !IsNaN(close[bubblemover + 1]);
AddChartBubble(mover, ppdh, "dh", ppdh.TakeValueColor());
AddChartBubble(mover, ppdl, "dl", ppdl.TakeValueColor());
AddChartBubble(mover, ppwh, "wh", ppwh.TakeValueColor());
AddChartBubble(mover, ppwl, "wl", ppwl.TakeValueColor());
plot pADBP = ADBP;
#