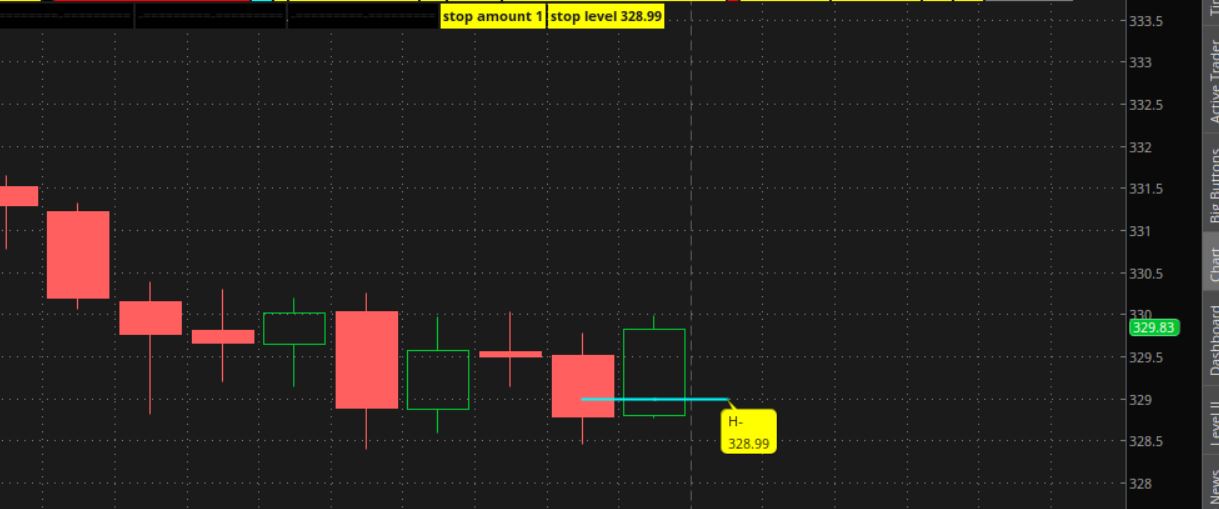
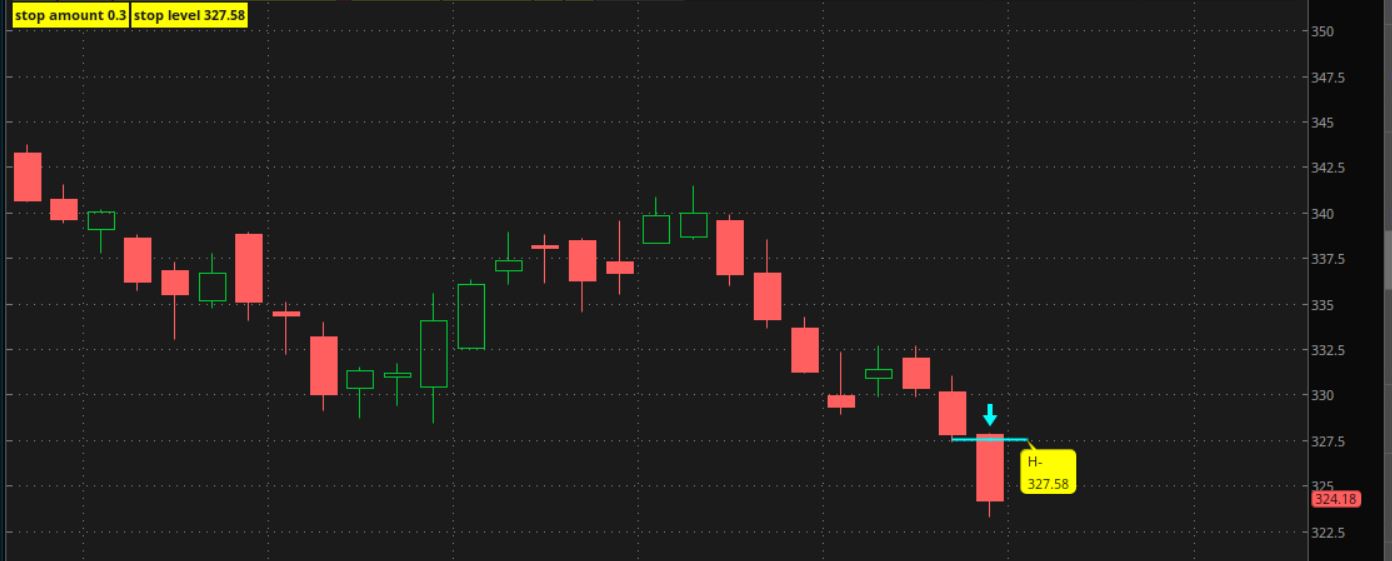
I want to plot a $1.00 trailing stop in TOS. This is not a volatility-based stop. It is just the trailing stop TOS uses in Active Trader to exit a trade on a $1.00 pullback from the current high. I have tried a variety of codes, but I haven't gotten it right yet.
#Lookup 20_Trail 1.00
#20 period midprice long-short condition
def LO = Lowest(low, 20);
def HI = Highest(high, 20);
def MID = ((HI - LO) / 2 + LO);
def MidOver = high > mid;
def MidUnder = low < mid;
#$1.00 trailing stop off the high
def LOW1 = Lowest(low, 1);
def HIGH1 = Highest(high, 1);
plot HiTrail = HIGH1 - 1.00;# and midover;
plot LoTrail = LOW1 + 1.00 ;#and midunder;