
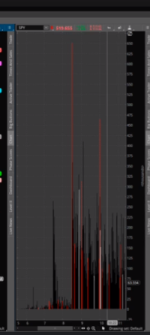
this is an indicator on thinkorswim that i saw some guy use. i know its hard to see but if you can zoom in you'll see, and it basically has vertical bars showing the amount of divergence between a stock of choice and is compared to spy (s&p500) and basically showing how much a stock is following spy, for example on the 1 minute chart tesla was going down while spy was going up so tesla was showing weakness and the indicator had a vertical bar that was red (not following spy) and the height of the bar is how much it isn't corresponding with spy. another example is tesla was going up and spy was going up on the 1 minute chart, since it was following spy the indicator showed a black bar (following spy) and the height of the bar is based on how much is it exactly following spy, the more closely it corresponds the higher the black bar. please can someone code this indicator for me i have been trying to code this for like 5 days now non stop and i just cant figure it out.
convergence and divergence of correlation
- Thread starter nicksalv
- Start date
Join useThinkScript to post your question to a community of 21,000+ developers and traders.
| Thread starter | Similar threads | Forum | Replies | Date |
|---|---|---|---|---|
|
|
Divergence Filter for Moving Average Crossing | Questions | 3 | |
| M | stochastic divergence minus smoothing | Questions | 0 | |
| D | Divergence Between Two Symbols | Questions | 2 | |
| M | Can you create a stochastic divergence as picture below? | Questions | 6 | |
| R | $ADD $TICK $VOLD trading strategy- Divergence Indicator | Questions | 5 |
Similar threads
-

-
-
-
Can you create a stochastic divergence as picture below?
- Started by Michael Kim
- Replies: 6
-
$ADD $TICK $VOLD trading strategy- Divergence Indicator
- Started by Ronathan Edwards
- Replies: 5
Similar threads
-
-
-
-
Can you create a stochastic divergence as picture below?
- Started by Michael Kim
- Replies: 6
-
$ADD $TICK $VOLD trading strategy- Divergence Indicator
- Started by Ronathan Edwards
- Replies: 5
Similar threads
-
-
-
-
Can you create a stochastic divergence as picture below?
- Started by Michael Kim
- Replies: 6
-
$ADD $TICK $VOLD trading strategy- Divergence Indicator
- Started by Ronathan Edwards
- Replies: 5
The Market Trading Game Changer
Join 2,500+ subscribers inside the useThinkScript VIP Membership Club
- Exclusive indicators
- Proven strategies & setups
- Private Discord community
- ‘Buy The Dip’ signal alerts
- Exclusive members-only content
- Add-ons and resources
- 1 full year of unlimited support
Frequently Asked Questions
What is useThinkScript?
useThinkScript is the #1 community of stock market investors using indicators and other tools to power their trading strategies. Traders of all skill levels use our forums to learn about scripting and indicators, help each other, and discover new ways to gain an edge in the markets.
How do I get started?
We get it. Our forum can be intimidating, if not overwhelming. With thousands of topics, tens of thousands of posts, our community has created an incredibly deep knowledge base for stock traders. No one can ever exhaust every resource provided on our site.
If you are new, or just looking for guidance, here are some helpful links to get you started.
- The most viewed thread:
https://usethinkscript.com/threads/repainting-trend-reversal-for-thinkorswim.183/ - Our most popular indicator:
https://usethinkscript.com/threads/buy-the-dip-indicator-for-thinkorswim.3553/ - Answers to frequently asked questions:
https://usethinkscript.com/threads/answers-to-commonly-asked-questions.6006/
What are the benefits of VIP Membership?
VIP members get exclusive access to these proven and tested premium indicators: Buy the Dip, Advanced Market Moves 2.0, Take Profit, and Volatility Trading Range. In addition, VIP members get access to over 50 VIP-only custom indicators, add-ons, and strategies, private VIP-only forums, private Discord channel to discuss trades and strategies in real-time, customer support, trade alerts, and much more. Learn all about VIP membership here.
How can I access the premium indicators?
To access the premium indicators, which are plug and play ready, sign up for VIP membership here.