$ADD $TICK $VOLD trading strategy- Divergence Indicator

1:51 / 6:57 • Intro TICK Divergences, Extreme TICK Alerts, & Cumulative TICK Indicators -The strategy isn't that complex, but it watches for the strengths and weaknesses of market internals. I found ONE indicator that shows divergence patterns on the $TICK chart (which you have to pay for) from TradeEdge coding for TOS. It gives alerts when the the TICK comes into possible exhaustion periods (when it hits the 600 and 800 levels and extreme levels 1000. It would be great to have someone make this indicator.

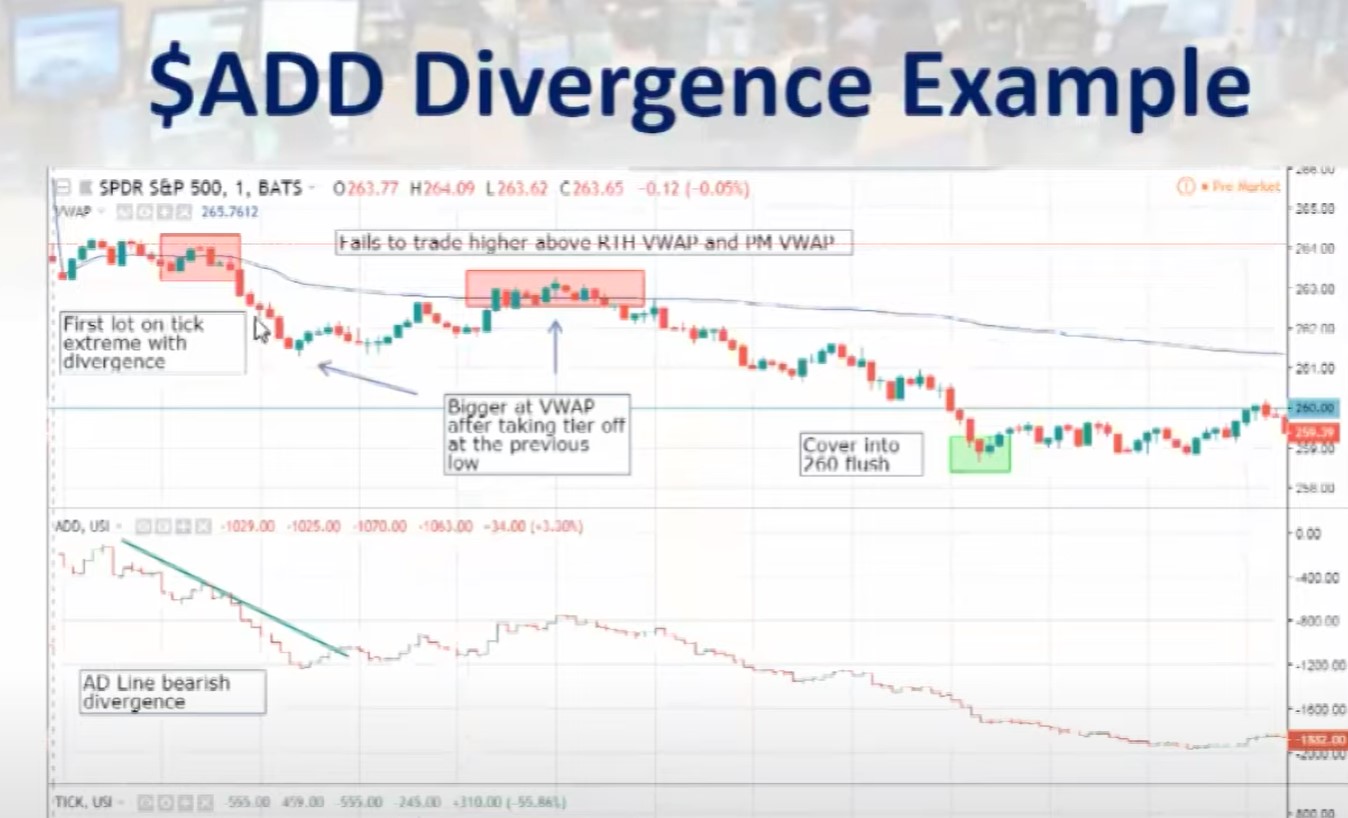
But also a major part of the strategy is the movement of the $ADD. Major levels are at zero and 2000 and -2000 for extremes and the 1500and 1800 levels. I can't find anywhere where there is an indicator finding divergences between the $ADD and the SPY.
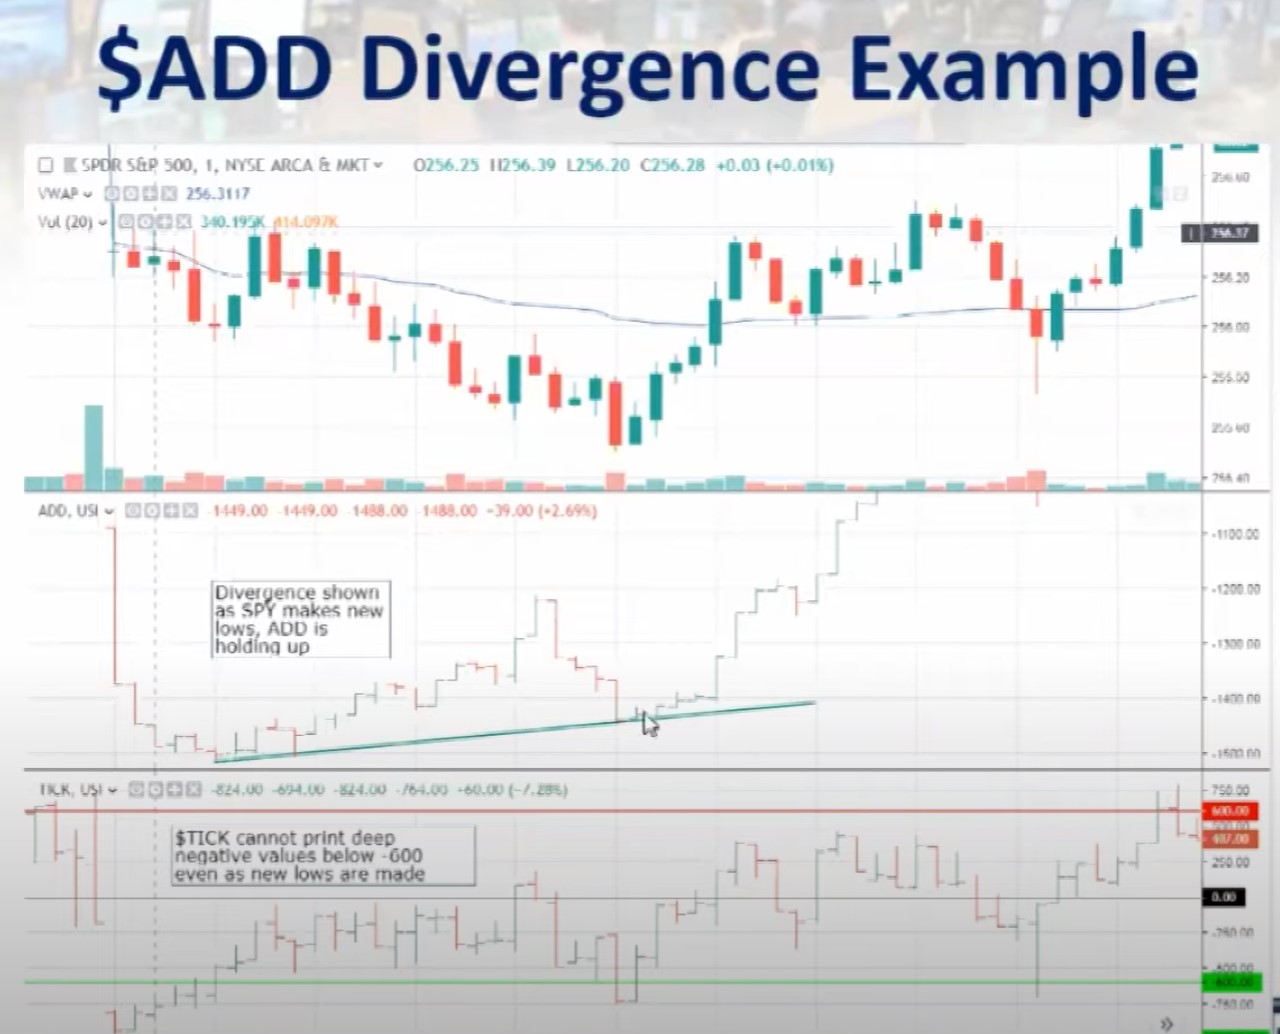
Last week for example I saw the ADD tanking as the SPY was going up, and I made a boatload on puts... It would be great to have an indicator that would show divergences on the ADD. @MerryDay ?
Here are examples:
98JXRU1.jpg

ktJMoh3.jpg
 
Last edited:
This may start to get at what you're interested in.

This uses INERTIA() which is just a linear regression slope to determine if the last 15 (default) bars are trending the same direction. If one line is negative and the others positive, it is a divergence.
it does not currently plot the $tick value, and the multipliers are required for now, but I suppose values could be converted to percentage changes at the expense of more code.

It DOES NOT LOOK FOR HIGHER HIGHS / LOWER LOWS at all.


Code:
declare lower;

def add = close(symbol = "$ADD");
def tick = close(symbol = "$TICK");
def spy = close(symbol = "SPY");
def vold = close(symbol = "$VOLD");

input length = 15;

def add_slope = Inertia(data = add, length = length);
def tick_slope = Inertia(data = tick, length = length);
def spy_slope = Inertia(data = spy, length = length);
def vold_slope = Inertia(data = vold, length = length);

plot add_dt = (add_slope - getValue(Add_slope, length)) / length;
plot spy_dt = (spy_slope - getValue(spy_slope, length)) / length * 500;
plot vold_dt = (vold_slope - getValue(vold_slope, length)) / length / 100000;

plot zero = 0;

If that is along the lines of what you're interested in, let me know. if not, let me know that too.

cheers,
mashume
 
Thanks, I'll check it out... tempted to buy the Tick Diverence ... but really want the ADD divergence also... Actually I want them to only have the SPY compared to... I don't want it comparing the ADD with the TICK... just the SPY... it would look like this
1699306801555.png
 
This may start to get at what you're interested in.

This uses INERTIA() which is just a linear regression slope to determine if the last 15 (default) bars are trending the same direction. If one line is negative and the others positive, it is a divergence.
it does not currently plot the $tick value, and the multipliers are required for now, but I suppose values could be converted to percentage changes at the expense of more code.

It DOES NOT LOOK FOR HIGHER HIGHS / LOWER LOWS at all.


Code:
declare lower;

def add = close(symbol = "$ADD");
def tick = close(symbol = "$TICK");
def spy = close(symbol = "SPY");
def vold = close(symbol = "$VOLD");

input length = 15;

def add_slope = Inertia(data = add, length = length);
def tick_slope = Inertia(data = tick, length = length);
def spy_slope = Inertia(data = spy, length = length);
def vold_slope = Inertia(data = vold, length = length);

plot add_dt = (add_slope - getValue(Add_slope, length)) / length;
plot spy_dt = (spy_slope - getValue(spy_slope, length)) / length * 500;
plot vold_dt = (vold_slope - getValue(vold_slope, length)) / length / 100000;

plot zero = 0;

If that is along the lines of what you're interested in, let me know. if not, let me know that too.

cheers,
mashume
@mashume Sorry to reply so late. I really just wanted a divergence for the ADDand ADSPD (to save script expense) ... which could detect through higher highs- lower lows, but I'll check this out. Thanks!
 
Last edited:
@mashume Sorry to reply so late. I really just wanted a divergence for the ADDand ADSPD (to save script expense) ... which could detect through higher highs- lower lows, but I'll check this out. Thank
This may start to get at what you're interested in.

This uses INERTIA() which is just a linear regression slope to determine if the last 15 (default) bars are trending the same direction. If one line is negative and the others positive, it is a divergence.
it does not currently plot the $tick value, and the multipliers are required for now, but I suppose values could be converted to percentage changes at the expense of more code.

It DOES NOT LOOK FOR HIGHER HIGHS / LOWER LOWS at all.


Code:
declare lower;

def add = close(symbol = "$ADD");
def tick = close(symbol = "$TICK");
def spy = close(symbol = "SPY");
def vold = close(symbol = "$VOLD");

input length = 15;

def add_slope = Inertia(data = add, length = length);
def tick_slope = Inertia(data = tick, length = length);
def spy_slope = Inertia(data = spy, length = length);
def vold_slope = Inertia(data = vold, length = length);

plot add_dt = (add_slope - getValue(Add_slope, length)) / length;
plot spy_dt = (spy_slope - getValue(spy_slope, length)) / length * 500;
plot vold_dt = (vold_slope - getValue(vold_slope, length)) / length / 100000;

plot zero = 0;

If that is along the lines of what you're interested in, let me know. if not, let me know that too.

cheers,
mashume
This is what I'm kinda looking for... today was a perfect example ... the ADD (and the ADSPD) and SPY were diverging beautifully... I would like to see some kind off upper study on the ADD chart drawing a line on the chart showing the diverence.... (like the yello
1701731035037.png
w lines)
 
Last edited:
This may start to get at what you're interested in.

This uses INERTIA() which is just a linear regression slope to determine if the last 15 (default) bars are trending the same direction. If one line is negative and the others positive, it is a divergence.
it does not currently plot the $tick value, and the multipliers are required for now, but I suppose values could be converted to percentage changes at the expense of more code.

It DOES NOT LOOK FOR HIGHER HIGHS / LOWER LOWS at all.


Code:
declare lower;

def add = close(symbol = "$ADD");
def tick = close(symbol = "$TICK");
def spy = close(symbol = "SPY");
def vold = close(symbol = "$VOLD");

input length = 15;

def add_slope = Inertia(data = add, length = length);
def tick_slope = Inertia(data = tick, length = length);
def spy_slope = Inertia(data = spy, length = length);
def vold_slope = Inertia(data = vold, length = length);

plot add_dt = (add_slope - getValue(Add_slope, length)) / length;
plot spy_dt = (spy_slope - getValue(spy_slope, length)) / length * 500;
plot vold_dt = (vold_slope - getValue(vold_slope, length)) / length / 100000;

plot zero = 0;

If that is along the lines of what you're interested in, let me know. if not, let me know that too.

cheers,
mashume
Mashume - quick question - is there an elegant way to normalize the variants above and combine to a single value? I would like to sum these to get to a single oscillator Kind thanks
 

Join useThinkScript to post your question to a community of 21,000+ developers and traders.

Not the exact question you're looking for?

Start a new thread and receive assistance from our community.

87k+ Posts
380 Online
Create Post

The Market Trading Game Changer

Join 2,500+ subscribers inside the useThinkScript VIP Membership Club
  • Exclusive indicators
  • Proven strategies & setups
  • Private Discord community
  • ‘Buy The Dip’ signal alerts
  • Exclusive members-only content
  • Add-ons and resources
  • 1 full year of unlimited support

Frequently Asked Questions

What is useThinkScript?

useThinkScript is the #1 community of stock market investors using indicators and other tools to power their trading strategies. Traders of all skill levels use our forums to learn about scripting and indicators, help each other, and discover new ways to gain an edge in the markets.

How do I get started?

We get it. Our forum can be intimidating, if not overwhelming. With thousands of topics, tens of thousands of posts, our community has created an incredibly deep knowledge base for stock traders. No one can ever exhaust every resource provided on our site.

If you are new, or just looking for guidance, here are some helpful links to get you started.

What are the benefits of VIP Membership?
VIP members get exclusive access to these proven and tested premium indicators: Buy the Dip, Advanced Market Moves 2.0, Take Profit, and Volatility Trading Range. In addition, VIP members get access to over 50 VIP-only custom indicators, add-ons, and strategies, private VIP-only forums, private Discord channel to discuss trades and strategies in real-time, customer support, trade alerts, and much more. Learn all about VIP membership here.
How can I access the premium indicators?
To access the premium indicators, which are plug and play ready, sign up for VIP membership here.
Back
Top