I've been working at this for awhile, but can't get it to work. Hoping I can get some help . . . .
I'm creating a scan that takes into account the % Percentage Change of a Primary Symbol and scans for a Secondary Symbol with the following criteria:
- Daily Aggregation over a 1 year time period.
- % Percentage Change of Secondary Symbol.
- Daily Bar Count of how many times Primary Symbol's % Percentage Change is ABOVE or BELOW the Secondary Symbol.'s % Percentage Change
- Create a scan based on the number of times (as a percentage value) the Primary Symbol does better/ worse than the Secondary Symbol.
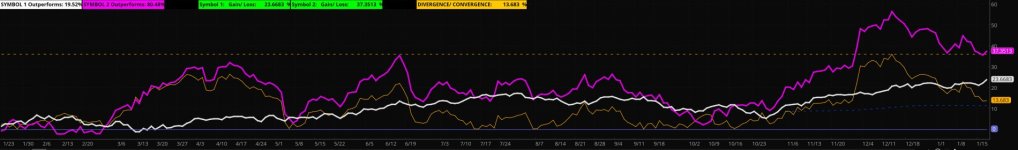
For example, I want to scan stocks that compare with the SPY % change and search for how often they out/ underperformed during the year. I'd like to search for different percentages of time greater than 50%, 60%, 70% etc.
Attaching code and an image the shows a chart of what I'm trying to turn into a scan. Can see that the Seconday (pink line) stays above the Primary 80% of the time.
Thank you to anyone who can help!!
input symbol = “SPY”;
input percent = .90;
def S1_open = open(symbol)[252] ;
def S1_close = close(symbol);
def S1_difference = S1_close - S1_open;
def S1_percent_diff = (S1_difference/ S1_open) * 100;
def S2_open = open[252];
def S2_close = close;
def S2_difference = S2_close - S2_open;
def S2_percent_diff = (S2_difference/ S2_open) * 100 ;
def S1_over = TotalSum(S1_percent_diff is greater than S2_percent_diff);
def S2_over = TotalSum(S2_percent_diff is greater than S1_percent_diff);
def Bar_Total = S1_over + S2_over;
def S1_over_percent = (S1_over/ Bar_Total);
def S2_over_percent = (S2_over/ Bar_Total);
plot scan = S2_over_percent is greater than percent;
I'm creating a scan that takes into account the % Percentage Change of a Primary Symbol and scans for a Secondary Symbol with the following criteria:
- Daily Aggregation over a 1 year time period.
- % Percentage Change of Secondary Symbol.
- Daily Bar Count of how many times Primary Symbol's % Percentage Change is ABOVE or BELOW the Secondary Symbol.'s % Percentage Change
- Create a scan based on the number of times (as a percentage value) the Primary Symbol does better/ worse than the Secondary Symbol.
For example, I want to scan stocks that compare with the SPY % change and search for how often they out/ underperformed during the year. I'd like to search for different percentages of time greater than 50%, 60%, 70% etc.
Attaching code and an image the shows a chart of what I'm trying to turn into a scan. Can see that the Seconday (pink line) stays above the Primary 80% of the time.
Thank you to anyone who can help!!
input symbol = “SPY”;
input percent = .90;
def S1_open = open(symbol)[252] ;
def S1_close = close(symbol);
def S1_difference = S1_close - S1_open;
def S1_percent_diff = (S1_difference/ S1_open) * 100;
def S2_open = open[252];
def S2_close = close;
def S2_difference = S2_close - S2_open;
def S2_percent_diff = (S2_difference/ S2_open) * 100 ;
def S1_over = TotalSum(S1_percent_diff is greater than S2_percent_diff);
def S2_over = TotalSum(S2_percent_diff is greater than S1_percent_diff);
def Bar_Total = S1_over + S2_over;
def S1_over_percent = (S1_over/ Bar_Total);
def S2_over_percent = (S2_over/ Bar_Total);
plot scan = S2_over_percent is greater than percent;