I was trying this script, but does not work, anyone can help to modidy ?
=============================================
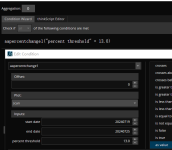
input startDate = 20210719;
input endDate = 20210725;
input percentThreshold = 3.0;
def targetPeriod = DaysFromDate(startDate) >= 0 and DaysTillDate(endDate) >= 0;
rec trackHighest = if targetPeriod and !targetPeriod[1] then high else if targetPeriod and high > trackHighest[1] then high else trackHighest[1];
rec trackStartPrice = if targetPeriod and !targetPeriod[1] then close else trackStartPrice[1];
def percentChange = 100 * (trackHighest / trackStartPrice - 1);
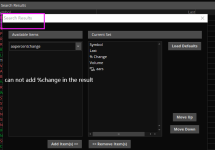
plot scan = percentChange > percentThreshold;
============================(the source is https://www.hahn-tech.com/ans/percent-change-within-a-specific-time-period/)
=============================================
input startDate = 20210719;
input endDate = 20210725;
input percentThreshold = 3.0;
def targetPeriod = DaysFromDate(startDate) >= 0 and DaysTillDate(endDate) >= 0;
rec trackHighest = if targetPeriod and !targetPeriod[1] then high else if targetPeriod and high > trackHighest[1] then high else trackHighest[1];
rec trackStartPrice = if targetPeriod and !targetPeriod[1] then close else trackStartPrice[1];
def percentChange = 100 * (trackHighest / trackStartPrice - 1);
plot scan = percentChange > percentThreshold;
============================(the source is https://www.hahn-tech.com/ans/percent-change-within-a-specific-time-period/)
Last edited by a moderator: