Parabolic SAR (PSAR) Scan, Watchlist, Labels, Charts For ThinkOrSwim

this is my polished version of the addition to pSAR:

#============ PLOT OF INFORMATION REGARDING pSAR AND PRICE RELATION ============================

input ShowLabel = yes;

# PAST STATES pSAR LEVELS AND PERCENTAGE DISTANCE OF CLOSE TO THEM AT STATE CHANGE TIME*******************

def StateChange = if state == state.long and state[1] == state.short then 1 else if state == state.short and state[1] == state.long then -1 else 0;

def sar_level = if statechange <> 0 then sar else sar_level[1];
plot level = if ShowLabel and !IsNaN(close) then sar_level else Double.Nan;


AddChartBubble(StateChange == 1 and ShowLabel, sar*1.000, round(-(level-close)/level*100,2) +"% $"+ round(level,2), Color.UPTICK, no);
AddChartBubble(StateChange == -1 and ShowLabel,sar*1.000, round(-(level-close)/level*100,2) +"% $"+round(level,2),Color.DOWNTICK ,yes);


# COUNT OF PERIODS AT EACH OF PAST STATES ***************************************************************

def longcount = if StateChange == 1 then 1 else if state == state.long then longcount[1] + 1 else 0 ;
AddChartBubble(state == state.long and state[-1] == state.short, level, longcount+" "+round((close - level)/level*100,2)+"%", Color.UPTICK,yes);
def shortcount = if StateChange == -1 then 1 else if state == state.short then shortcount[1] + 1 else 0 ;
AddChartBubble(state == state.short and state[-1] == state.long, level, shortcount+" "+round((close - level)/level*100,2)+"%", Color.DOWNTICK,no);


# COUNT OF PERIODS AT CURRENT STATE ***************************************************************

AddChartBubble(state == state.long and isnan(close[-1]), level, longcount, Color.CYAN,yes);
AddChartBubble(state == state.short and isnan(close[-1]), level, shortcount, Color.YELLOW,no);


# CURRENT pSAR LEVEL AND PERCENTAGE DISTANCE OF CLOSE TO IT ****************************************

AddChartBubble(state == state.long and isnan(close[-1]), parsar, round(-(sar-close)/sar*100,2) +"% $"+round(parsar,2), Color.CYAN,no);
AddChartBubble(state == state.short and isnan(close[-1]), parsar, round(-(sar-close)/sar*100,2) +"% $"+round(parsar,2), Color.YELLOW,yes);


View attachment 19969


View attachment 19970

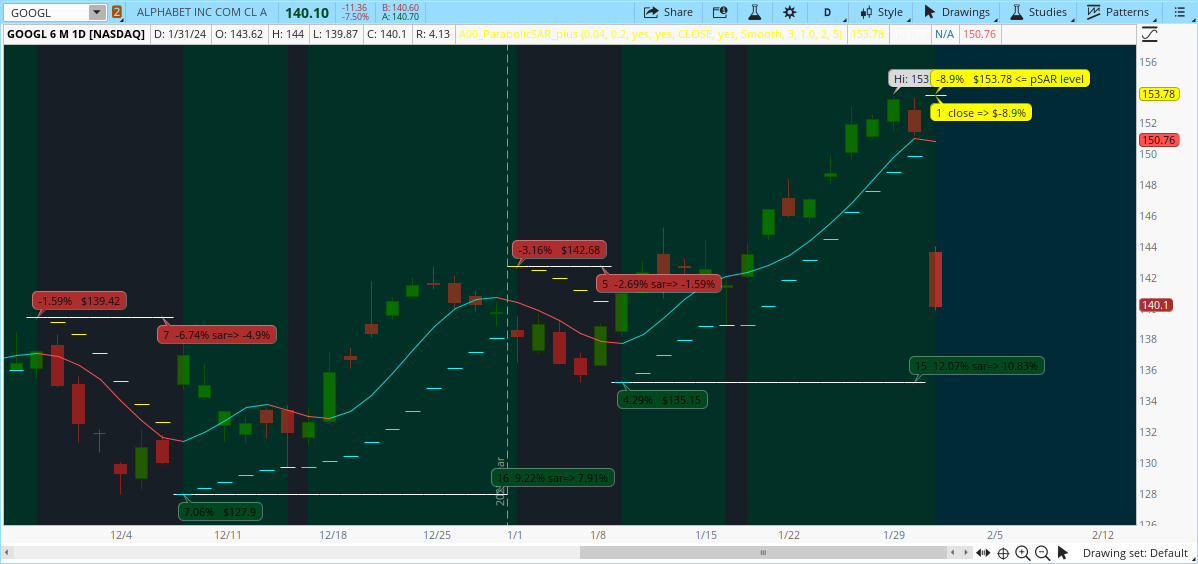
this code added to the built in Parabolic SAR, which I did for my own use, will provide more detailed information to, not only past pSAR behavior related to price as well as more current information, including a simple projection for next period pSAR. you can create a new indicator using the original built-in code for the pSAR and add at the end the code below:

########################################################################################
###################### BELOW IS ADDITIONAL CODE TO BUILT-IN parabolicSAR ###############
########################################################################################


parSAR.SetPaintingStrategy(PaintingStrategy.DASHES);
#parSAR.SetPaintingStrategy(PaintingStrategy.POINTS);
parSAR.SetLineWeight(1);

parSAR.DefineColor("Up", Color.CYAN);
parSAR.DefineColor("Down", Color.YELLOW);
parSAR.DefineColor("Flat", Color.GRAY);

parSAR.AssignValueColor(if (SAR < low) then parSAR.Color("Up") else parSAR.Color("Down") );

# =================== COLOR TREND IN PRICE GRAPH====================================

def up = SAR < low ;

def pos = Double.POSITIVE_INFINITY;
def neg = Double.NEGATIVE_INFINITY;

DefineGlobalColor("dgreen" , CreateColor(0,59,0));
DefineGlobalColor("dred" , CreateColor(79,0,0));
AddCloud(if up then pos else neg, if up then neg else pos, GlobalColor("dgreen"), GlobalColor("dred"));


#============ PLOT OF INFORMATION REGARDING pSAR AND PRICE RELATION ============================

input ShowLabel = yes;

# PAST STATES pSAR LEVELS AND PERCENTAGE DISTANCE OF CLOSE TO THEM AT STATE CHANGE TIME*******************

def StateChange = if state == state.long and state[1] == state.short then 1 else if state == state.short and state[1] == state.long then -1 else 0;

def sar_level = if statechange <> 0 then sar else sar_level[1];
plot level = if ShowLabel and !IsNaN(close) then sar_level else Double.Nan;
level.SetPaintingStrategy(PaintingStrategy.HORIZONTAL);
level.SetLineWeight(1);
level.AssignValueColor(color.WHITE);


AddChartBubble(StateChange == 1 and ShowLabel and !isnan(close[-1]), sar*1.000, round(-(level-close)/level*100,2) +"% $"+ round(level,2), Color.UPTICK, no);
AddChartBubble(StateChange == -1 and ShowLabel and !isnan(close[-1]),sar*1.000, round(-(level-close)/level*100,2) +"% $"+round(level,2),Color.DOWNTICK ,yes);


# COUNT OF PERIODS AT EACH OF PAST STATES ***************************************************************

def longcount = if StateChange == 1 then 1 else if state == state.long then longcount[1] + 1 else 0 ;
AddChartBubble(state == state.long and state[-1] == state.short, level, longcount+" "+round((close - level)/level*100,2)+"% sar=> " + round((sar - level)/level*100,2)+"%" , Color.UPTICK,yes);
def shortcount = if StateChange == -1 then 1 else if state == state.short then shortcount[1] + 1 else 0 ;
AddChartBubble(state == state.short and state[-1] == state.long, level, shortcount+" "+round((close - level)/level*100,2)+"% sar=> " + round((sar - level)/level*100,2)+"%", Color.DOWNTICK,no);


# COUNT OF PERIODS AT CURRENT STATE ***************************************************************
AddChartBubble(state == state.long and isnan(close[-1]) and ShowLabel, level, longcount + " close => $" + round(-(level-close)/level*100,2) +"%", Color.CYAN,yes);
AddChartBubble(state == state.short and isnan(close[-1]) and ShowLabel, level, shortcount + " close => $" + round(-(level-close)/level*100,2) +"%", Color.YELLOW,no);

# CURRENTR pSAR LEVEL AND PERCENTAGE DISTANCE OF CLOSE TO IT ****************************************

AddChartBubble(state == state.long and isnan(close[-1]) and ShowLabel, parsar, round(-(sar-close)/sar*100,2) +"% $"+round(parsar,2) + " <= pSAR level", Color.CYAN,no);
AddChartBubble(state == state.short and isnan(close[-1]) and ShowLabel, parsar, round(-(sar-close)/sar*100,2) +"% $"+round(parsar,2) + " <= pSAR level", Color.YELLOW,yes);

# Simple Linear Projection estimate for next future period ********************************************

def angle = (parsar - parsar[1]);
def proj = angle+parsar;
def ook = parSAR == level ;
def angle_percent = ((proj-parSAR) /parSAR)*100;

plot projection = if isnan(close[-1]) and isnan(close) and !ook[1] and ShowLabel then proj[1] else Double.Nan;
AddChartBubble(isnan(close[-1]) and isnan(close) and ShowLabel , projection,"$"+ round(projection,2)+" "+ round(angle_percent[1],2)+"%"+" <= next stop ", Color.white,no);

projection.SetPaintingStrategy(PaintingStrategy.SQUARES);
projection.SetLineWeight(4);
projection.AssignValueColor(color.WHITE);

#######################################################################


1700618440278.png
 
Last edited:

Join useThinkScript to post your question to a community of 21,000+ developers and traders.

Latest iteration: http://tos.mx/Qddi45l
DzXn3t9.png

Ruby:
#original parabolic sar from TOS till ine 69, except acceleration.
#just added some stuff after the original code for my visual perception

input accelerationFactor = 0.04; #original =0.02
input accelerationLimit = 0.2;

Assert(accelerationFactor > 0, "'acceleration factor' must be positive: " + accelerationFactor);
Assert(accelerationLimit >= accelerationFactor, "'acceleration limit' (" + accelerationLimit + ") must be greater than or equal to 'acceleration factor' (" + accelerationFactor + ")");

def state = {default init, long, short};
def extreme;
def SAR;
def acc;


switch (state[1]) {
case init:
    state = state.long;
    acc = accelerationFactor;
    extreme = high;
    SAR = low;
 
case short:
    if (SAR[1] < high)
    then {
        state = state.long;
        acc = accelerationFactor;
        extreme = high;
        SAR = extreme[1];
 
    } else {
        state = state.short;
        if (low < extreme[1])
        then {
            acc = Min(acc[1] + accelerationFactor, accelerationLimit);
            extreme = low;
        } else {
            acc = acc[1];
            extreme = extreme[1];
        }
        SAR = Max(Max(high, high[1]), SAR[1] + acc * (extreme - SAR[1]));
   
    }
case long:
    if (SAR[1] > low)
    then {
        state = state.short;
        acc = accelerationFactor;
        extreme = low;
        SAR = extreme[1];
 
    } else {
        state = state.long;
        if (high > extreme[1])
        then {
            acc = Min(acc[1] + accelerationFactor, accelerationLimit);
            extreme = high;
        } else {
            acc = acc[1];
            extreme = extreme[1];
        }
        SAR = Min(Min(low, low[1]), SAR[1] + acc * (extreme - SAR[1]));
    }
}

plot parSAR = SAR;
parSAR.SetPaintingStrategy(PaintingStrategy.POINTS);
parSAR.SetDefaultColor(GetColor(5));

# ^^^^^^^^^^^^^^^^^^^^^ ABOVE IS THE ORIGINAL BUILT-IN THINKORSWIM CODE ^^^^^^^^^^^^^^ #

########################################################################################
###################### BELOW IS ADDITIONAL CODE TO BUILT-IN parabolicSAR ###############
########################################################################################


parSAR.SetPaintingStrategy(PaintingStrategy.DASHES);
#parSAR.SetPaintingStrategy(PaintingStrategy.POINTS);
parSAR.SetLineWeight(1);

parSAR.DefineColor("Up", Color.CYAN);
parSAR.DefineColor("Down", Color.YELLOW);
parSAR.DefineColor("Flat", Color.GRAY);

parSAR.AssignValueColor(if (SAR < low) then parSAR.Color("Up") else parSAR.Color("Down") );

# ===================   COLOR TREND IN PRICE GRAPH====================================

#def up      = SAR < low ;

#def pos = Double.POSITIVE_INFINITY;
#def neg = Double.NEGATIVE_INFINITY;

input back_color = yes;
def up      =  SAR < low ;

def pos = if back_color then Double.POSITIVE_INFINITY else Double.NaN;
def neg = if back_color then Double.NEGATIVE_INFINITY else Double.NaN;

DefineGlobalColor("dgreen" , CreateColor(0,59,0));
DefineGlobalColor("dred"   , CreateColor(79,0,0));
AddCloud(if up then pos else neg, if up then neg else pos, GlobalColor("dgreen"), GlobalColor("dred"));


#============ PLOT OF INFORMATION REGARDING pSAR AND PRICE RELATION ============================

input ShowLabel = yes;

# PAST STATES pSAR LEVELS AND PERCENTAGE DISTANCE OF CLOSE TO THEM AT STATE CHANGE TIME*******************

def StateChange = if state == state.long and state[1] == state.short then 1 else if state == state.short and state[1] == state.long then -1 else 0;

def sar_level = if statechange <> 0 then sar else sar_level[1];
plot level = if ShowLabel and !IsNaN(close) then sar_level else Double.Nan;
level.SetPaintingStrategy(PaintingStrategy.HORIZONTAL);
level.SetLineWeight(1);
level.AssignValueColor(color.WHITE);


AddChartBubble(StateChange == 1 and ShowLabel and !isnan(close[-1]), sar*1.000, round(-(level-close)/level*100,2) +"%   $"+ round(level,2), Color.UPTICK, no);
AddChartBubble(StateChange == -1 and ShowLabel and !isnan(close[-1]),sar*1.000, round(-(level-close)/level*100,2) +"%   $"+round(level,2),Color.DOWNTICK  ,yes);


# COUNT OF PERIODS AT EACH OF PAST STATES ***************************************************************

def longcount = if StateChange == 1 then 1 else if state == state.long then longcount[1] + 1 else 0 ;
AddChartBubble(state == state.long and state[-1] == state.short, level, longcount+"  "+round((close - level)/level*100,2)+"% sar=> " + round((sar - level)/level*100,2)+"%" , Color.UPTICK,yes);
def shortcount = if StateChange == -1 then 1 else if state == state.short then shortcount[1] + 1 else 0 ;
AddChartBubble(state == state.short and state[-1] == state.long, level, shortcount+"  "+round((close - level)/level*100,2)+"% sar=> " + round((sar - level)/level*100,2)+"%", Color.DOWNTICK,no);


# COUNT OF PERIODS AT CURRENT STATE ***************************************************************
AddChartBubble(state == state.long and isnan(close[-1]) and ShowLabel, level, longcount + "  close => $" + round(-(level-close)/level*100,2) +"%", Color.CYAN,yes);
AddChartBubble(state == state.short and isnan(close[-1]) and ShowLabel, level, shortcount + "  close => $" + round(-(level-close)/level*100,2) +"%", Color.YELLOW,no);

# CURRENTR pSAR LEVEL AND PERCENTAGE DISTANCE OF CLOSE TO IT ****************************************

AddChartBubble(state == state.long and isnan(close[-1]) and ShowLabel, parsar, round(-(sar-close)/sar*100,2) +"%   $"+round(parsar,2) + " <= pSAR level", Color.CYAN,no);
AddChartBubble(state == state.short and isnan(close[-1]) and ShowLabel, parsar, round(-(sar-close)/sar*100,2) +"%   $"+round(parsar,2) + " <= pSAR level", Color.YELLOW,yes);

# Simple Linear Projection estimate for next future period ********************************************

def angle = (parsar - parsar[1]);
def proj = angle+parsar;
def ook = parSAR == level ;
def angle_percent = ((proj-parSAR) /parSAR)*100;

plot projection = if isnan(close[-1]) and isnan(close) and !ook[1] and ShowLabel then proj[1] else Double.Nan;
AddChartBubble(isnan(close[-1]) and isnan(close) and ShowLabel , projection,"$"+ round(projection,2)+"  "+ round(angle_percent[1],2)+"%"+" <= next stop ", Color.white,no);

projection.SetPaintingStrategy(PaintingStrategy.SQUARES);
projection.SetLineWeight(4);
projection.AssignValueColor(color.WHITE);

##################### QUADRATIC REGRESSION - kreg  ###################################
#// © jdehorty © veryfid
#indicator(title='Kernel Regression Toolkit', shorttitle='kreg', overlay=true)
#import veryfid/KernelFunctionsFilters/1 as kreg
#// For more information on this technique refer to to the original open source indicator by @jdehorty located here:
#// https://www.tradingview.com/script/AWNvbPRM-Nadaraya-Watson-Rational-Quadratic-Kernel-Non-Repainting/
#// Nadaraya-Watson Kernel Regression Settings
# Converted by Sam4Cok@Samer800    - 11/2023
# this version displays just one regression as it can be trated as a single moving average with trend coloring and includes scanning posssiblity as TOS does not consider it TOO COMPLEX

input src = close;

input showRegLine1 = yes;
input filterType1 = {"No Filter", default "Smooth", "Zero Lag"};
input LookbackWindow1 = 3;         # 'Lookback Window', Recommended range: 3-50
input RelativeWeighting1 = 1.0;    # 'Relative weighting of time frames. Recommended range: 0.25-25'
input Level1 = 2;                  # 'Bar index on which to start regression. Recommended range: 2-25'


def na = Double.NaN;
DefineGlobalColor("up", CreateColor(0,213,213));
DefineGlobalColor("dn", CreateColor(255,82,82));
def h1 = LookbackWindow1;
def r1 = RelativeWeighting1;
def x1 = Level1;


#rationalQuadratic(_src, _lookback, _relativeWeight, startAtBar,string _filter) =>
script rationalQuadratic {
    input _src = close;
    input _lookback = 8;
    input _relativeWeight = 1;
    input startAtBar = 25;
    input _filter = "No Filter";
    def _size = 2;
    def factor = Sqr(_lookback) * 2 * _relativeWeight;
    def _currentWeight = fold i = 0 to _size + startAtBar with p do
        p + _src[i] * Power(1 + (Sqr(i) / factor), -_relativeWeight);
    def _cumulativeWeight = fold i1 = 0 to _size + startAtBar with p1 do
        p1 + Power(1 + (Sqr(i1) / factor), -_relativeWeight);
    def yhatdelt = _currentWeight / _cumulativeWeight;
    def _currentWeight2 = fold j = 0 to _size + startAtBar with q do
        q + yhatdelt[j] * Power(1 + (Sqr(j) / factor), -_relativeWeight);
    def yhatdelt2 = _currentWeight2 / _cumulativeWeight;
    def yhat = yhatdelt2;
    def zlagcalc = 2 * yhatdelt - yhat;
    def lineout = if _filter == "No Filter" then yhatdelt else
                  if _filter == "Smooth" then yhat else
                  if _filter == "Zero Lag" then zlagcalc else yhatdelt;
    plot out = lineout;
}


def rq1 = rationalQuadratic(src, h1, r1, x1, filterType1);


plot Line11 = if !showRegLine1 then na else rq1;        # "Line1"
Line11.AssignValueColor(if rq1 > rq1[1] then GlobalColor("up") else GlobalColor("dn"));


############################ END  OF KREG  ########################################


#================================================================================================
#code below is for scanning purposes only, so when charting just disable this plot +++++++++
input range_pct = 5;


def dist = (sar-close/close)*100;
def trend = if StateChange == 1 and dist >= -range_pct then 1 else if StateChange==-1 and  dist <= range_pct then -1 else 0;
#plot opportunity = if trend <> 0 then trend else Double.Nan;

#plot trendscan = if StateChange == 1 then 1 else if StateChange==-1 then -1 else 0;
 
Last edited by a moderator:
Thread starter Similar threads Forum Replies Date
F Repaints Multi-Time Frame MTF PSAR for ThinkorSwim Indicators 57
T PSAR Transition Indicator for ThinkorSwim Indicators 30

Similar threads

Not the exact question you're looking for?

Start a new thread and receive assistance from our community.

87k+ Posts
444 Online
Create Post

Similar threads

Similar threads

The Market Trading Game Changer

Join 2,500+ subscribers inside the useThinkScript VIP Membership Club
  • Exclusive indicators
  • Proven strategies & setups
  • Private Discord community
  • ‘Buy The Dip’ signal alerts
  • Exclusive members-only content
  • Add-ons and resources
  • 1 full year of unlimited support

Frequently Asked Questions

What is useThinkScript?

useThinkScript is the #1 community of stock market investors using indicators and other tools to power their trading strategies. Traders of all skill levels use our forums to learn about scripting and indicators, help each other, and discover new ways to gain an edge in the markets.

How do I get started?

We get it. Our forum can be intimidating, if not overwhelming. With thousands of topics, tens of thousands of posts, our community has created an incredibly deep knowledge base for stock traders. No one can ever exhaust every resource provided on our site.

If you are new, or just looking for guidance, here are some helpful links to get you started.

What are the benefits of VIP Membership?
VIP members get exclusive access to these proven and tested premium indicators: Buy the Dip, Advanced Market Moves 2.0, Take Profit, and Volatility Trading Range. In addition, VIP members get access to over 50 VIP-only custom indicators, add-ons, and strategies, private VIP-only forums, private Discord channel to discuss trades and strategies in real-time, customer support, trade alerts, and much more. Learn all about VIP membership here.
How can I access the premium indicators?
To access the premium indicators, which are plug and play ready, sign up for VIP membership here.
Back
Top