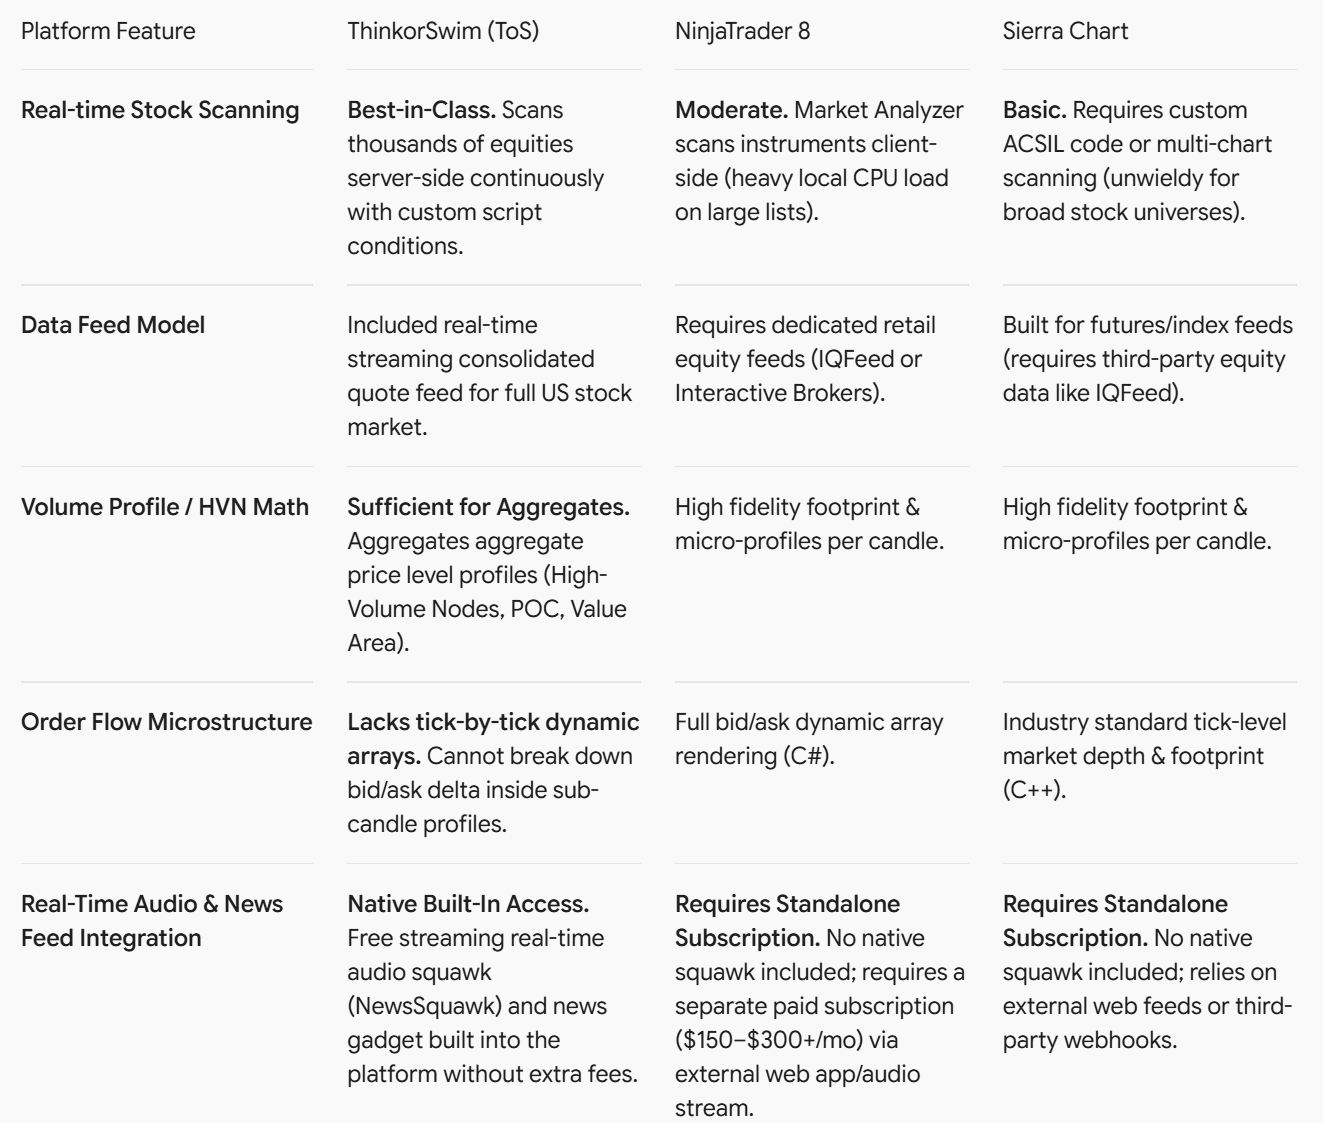
Order Flow Imbalance - displayed on bars

tkades

New member
VIP
Please could someone tell me if anything similar to this has been created? Besides the Bid-Ask Volume per candle, it bolds the large imbalances within each candle.
Another interesting feature is the Pressure bar (on the left).
Including the link to see this in action.
A few platforms offer this (Ninja) and we should also have this on TOS.
Any feedback would be appreciated.
1787633394267.png
 
Solution
Please could someone tell me if anything similar to this has been created? Besides the Bid-Ask Volume per candle, it bolds the large imbalances within each candle.
Another interesting feature is the Pressure bar (on the left).
Including the link to see this in action.
A few platforms offer this (Ninja) and we should also have this on TOS.
Any feedback would be appreciated.

Sadly no; there is no such indicator on this forum.
Please could someone tell me if anything similar to this has been created? Besides the Bid-Ask Volume per candle, it bolds the large imbalances within each candle.
Another interesting feature is the Pressure bar (on the left).
Including the link to see this in action.
A few platforms offer this (Ninja) and we should also have this on TOS.
Any feedback would be appreciated.

Sadly no; there is no such indicator on this forum.
 
Solution
Sadly no; there is no such indicator on this forum.
If TOS data is accessible then isn't it doable? e.g. Volume Profile gives summed buy and sell transactions, even on this site we have Market Cumulative Delta, and Order Flow, and Auction Control Index. Doesn't this mean that aggressive buy and sell transaction data is available? If time on the Volume profile could be set to one candle, then that candle would have the data. Isn't it then just a matter of scaling it out candle by candle?
 

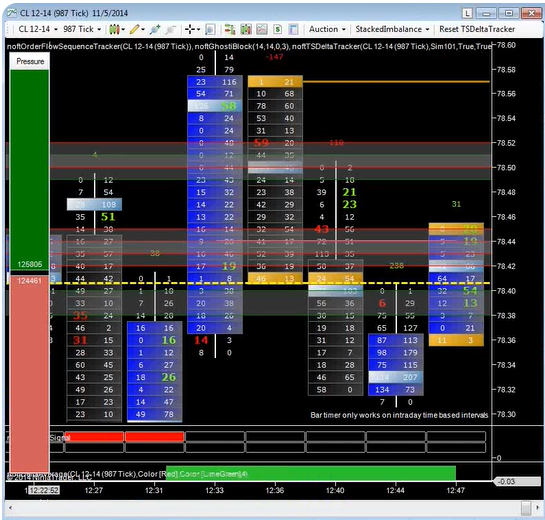
Core Limitations of ThinkorSwim & thinkScript​

  1. Custom Graphics Limitations
    ToS does not support custom canvas drawing or UI components like a standalone "pressure bar" adjacent to candles. Custom scripts are restricted to plotting lines, histograms, candle overlays, or basic background highlights.
  2. No Access to Tick-Level Bid/Ask Data
    True order flow requires real-time and historical tick data tagged with Bid vs. Ask trade executions (i.e., whether an order lifted the offer or hit the bid). ToS aggregates market data into candles/bars without providing historical tick-level side-attribution to thinkScript.
  3. Language & Data Structure Restrictions (No Arrays or Dynamic Bucket Sort)
    Even if ToS provided aggregated volume data, thinkScript lacks data structures like arrays, lists, or dictionaries. As a result, thinkScript cannot:
    • Categorize volume into dynamic price buckets inside individual candles.
    • Store, sort, or sum transactions at specific price levels dynamically.
    • Calculate stacked volume imbalances dynamically per candle.
  4. Proxies vs. True Cumulative Delta
    Yes, you are correct. On this site, community members have built ingenious proxies using sub-minute tick aggregation or high/low volume approximations, these remain math-based estimations. They do not represent true trade-by-trade cumulative delta or auction flow.
  5. External Tools Integration
    Add-ons like Bookmap provide depth-of-market and liquidity visualizations inside ToS via a separate subscription, but that data stream is isolated and cannot be referenced or manipulated inside thinkScript code.

ThinkOrSwim is considered the gold standard for technical chartists. But it is not a good fit for everyone.
SEEtOlO.png


Hope this helps,
@tkades
 
Last edited by a moderator:

Core Limitations of ThinkorSwim & thinkScript​

  1. Custom Graphics Limitations
    ToS does not support custom canvas drawing or UI components like a standalone "pressure bar" adjacent to candles. Custom scripts are restricted to plotting lines, histograms, candle overlays, or basic background highlights.
  2. No Access to Tick-Level Bid/Ask Data
    True order flow requires real-time and historical tick data tagged with Bid vs. Ask trade executions (i.e., whether an order lifted the offer or hit the bid). ToS aggregates market data into candles/bars without providing historical tick-level side-attribution to thinkScript.
  3. Language & Data Structure Restrictions (No Arrays or Dynamic Bucket Sort)
    Even if ToS provided aggregated volume data, thinkScript lacks data structures like arrays, lists, or dictionaries. As a result, thinkScript cannot:
    • Categorize volume into dynamic price buckets inside individual candles.
    • Store, sort, or sum transactions at specific price levels dynamically.
    • Calculate stacked volume imbalances dynamically per candle.
  4. Proxies vs. True Cumulative Delta
    Yes, you are correct. On this site, community members have built ingenious proxies using sub-minute tick aggregation or high/low volume approximations, these remain math-based estimations. They do not represent true trade-by-trade cumulative delta or auction flow.
  5. External Tools Integration
    Add-ons like Bookmap provide depth-of-market and liquidity visualizations inside ToS via a separate subscription, but that data stream is isolated and cannot be referenced or manipulated inside thinkScript code.

ThinkOrSwim is considered the gold standard for technical chartists. But it is not a good fit for everyone.
SEEtOlO.png


Hope this helps,
@tkades
Thanks for the replies, they helped me get the full lay of the land. So, I'm going to do my analysis with ATAS with CQG and Rithmic data feeds with order flow, heat maps etc. but still take my trades on the TOS SPX 0DTE Option Chain which is what I am familiar with.
 
If TOS data is accessible then isn't it doable? e.g. Volume Profile gives summed buy and sell transactions, even on this site we have Market Cumulative Delta, and Order Flow, and Auction Control Index. Doesn't this mean that aggressive buy and sell transaction data is available? If time on the Volume profile could be set to one candle, then that candle would have the data. Isn't it then just a matter of scaling it out candle by candle?
Thanks for letting me know.
 

Join useThinkScript to post your question to a community of 21,000+ developers and traders.

Similar threads

Not the exact question you're looking for?

Start a new thread and receive assistance from our community.

87k+ Posts
1578 Online
Create Post

Similar threads

Similar threads

The Market Trading Game Changer

Join 2,500+ subscribers inside the useThinkScript VIP Membership Club
  • Exclusive indicators
  • Proven strategies & setups
  • Private Discord community
  • ‘Buy The Dip’ signal alerts
  • Exclusive members-only content
  • Add-ons and resources
  • 1 full year of unlimited support

Frequently Asked Questions

What is useThinkScript?

useThinkScript is the #1 community of stock market investors using indicators and other tools to power their trading strategies. Traders of all skill levels use our forums to learn about scripting and indicators, help each other, and discover new ways to gain an edge in the markets.

How do I get started?

We get it. Our forum can be intimidating, if not overwhelming. With thousands of topics, tens of thousands of posts, our community has created an incredibly deep knowledge base for stock traders. No one can ever exhaust every resource provided on our site.

If you are new, or just looking for guidance, here are some helpful links to get you started.

What are the benefits of VIP Membership?
VIP members get exclusive access to these proven and tested premium indicators: Buy the Dip, Advanced Market Moves 2.0, Take Profit, and Volatility Trading Range. In addition, VIP members get access to over 50 VIP-only custom indicators, add-ons, and strategies, private VIP-only forums, private Discord channel to discuss trades and strategies in real-time, customer support, trade alerts, and much more. Learn all about VIP membership here.
How can I access the premium indicators?
To access the premium indicators, which are plug and play ready, sign up for VIP membership here.
Back
Top