I found lot of orb indicators,
I am just looking to measure differences between orb high and low for 30 m and add a label above this candle for each day .
Is this possible? Can any one help ? My coding skill is very limited thanks
# ORB for TOS Mobile App
# Mobius
# V01.08.2018
def o = open;
def h = high;
def l = low;
def c = close;
def OpeningBell = getTime()[1] < RegularTradingStart(getYYYYMMDD()) and
getTime() > RegularTradingStart(getYYYYMMDD());
def RTH = getTime() >= RegularTradingStart(getYYYYMMDD()) and
getTime() <= RegularTradingEnd(getYYYYMMDD());
def ORActive = getTime() >= OpeningBell and
getTime() <= RegularTradingStart(getYYYYMMDD()) + 1800000;
def ORH = if OpeningBell
then h
else if ORActive and
h > ORH[1]
then h
else ORH[1];
def ORL = if OpeningBell
then l
else if ORActive and
l < ORL[1]
then l
else ORL[1];
plot ORhigh = if !ORActive and RTH
then ORH
else Double.NaN;
ORhigh.SetStyle(Curve.LONG_DASH);
ORhigh.SetLineWeight(3);
ORhigh.SetDefaultColor(Color.GREEN);
plot ORlow = if !ORActive and RTH
then ORL
else Double.NaN;
ORlow.SetStyle(Curve.LONG_DASH);
ORlow.SetLineWeight(3);
ORlow.SetDefaultColor(Color.RED);
def ORmeanActive = getTime() >= OpeningBell and
getTime() <= RegularTradingStart(getYYYYMMDD()) + 300000;
def ORmeanH = if OpeningBell
then h
else if ORmeanActive and h > ORmeanH[1]
then h
else ORmeanH[1];
def ORmeanL = if OpeningBell
then l
else if ORmeanActive and l < ORmeanL[1]
then l
else ORmeanL[1];
plot ORmean = if !ORmeanActive and RTH
then Round(((ORmeanH + ORmeanL) / 2) / TickSize(), 0) * TickSize()
else Double.NaN;
ORmean.SetStyle(Curve.LONG_DASH);
ORmean.SetLineWeight(3);
ORmean.SetDefaultColor(Color.YELLOW);
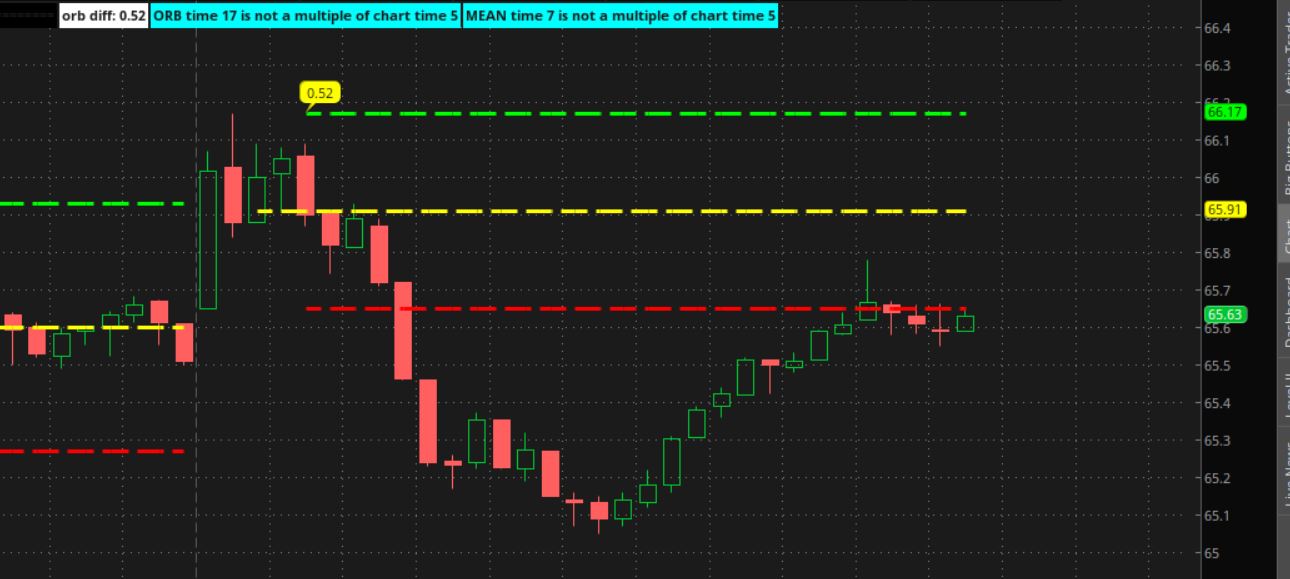
def diff = ORmeanH - ORmeanL ;
AddLabel(yes,
text = "orb diff: " + diff,
color = Color.WHITE
);
# End Code ORB for Mobile App
I am just looking to measure differences between orb high and low for 30 m and add a label above this candle for each day .
Is this possible? Can any one help ? My coding skill is very limited thanks
# ORB for TOS Mobile App
# Mobius
# V01.08.2018
def o = open;
def h = high;
def l = low;
def c = close;
def OpeningBell = getTime()[1] < RegularTradingStart(getYYYYMMDD()) and
getTime() > RegularTradingStart(getYYYYMMDD());
def RTH = getTime() >= RegularTradingStart(getYYYYMMDD()) and
getTime() <= RegularTradingEnd(getYYYYMMDD());
def ORActive = getTime() >= OpeningBell and
getTime() <= RegularTradingStart(getYYYYMMDD()) + 1800000;
def ORH = if OpeningBell
then h
else if ORActive and
h > ORH[1]
then h
else ORH[1];
def ORL = if OpeningBell
then l
else if ORActive and
l < ORL[1]
then l
else ORL[1];
plot ORhigh = if !ORActive and RTH
then ORH
else Double.NaN;
ORhigh.SetStyle(Curve.LONG_DASH);
ORhigh.SetLineWeight(3);
ORhigh.SetDefaultColor(Color.GREEN);
plot ORlow = if !ORActive and RTH
then ORL
else Double.NaN;
ORlow.SetStyle(Curve.LONG_DASH);
ORlow.SetLineWeight(3);
ORlow.SetDefaultColor(Color.RED);
def ORmeanActive = getTime() >= OpeningBell and
getTime() <= RegularTradingStart(getYYYYMMDD()) + 300000;
def ORmeanH = if OpeningBell
then h
else if ORmeanActive and h > ORmeanH[1]
then h
else ORmeanH[1];
def ORmeanL = if OpeningBell
then l
else if ORmeanActive and l < ORmeanL[1]
then l
else ORmeanL[1];
plot ORmean = if !ORmeanActive and RTH
then Round(((ORmeanH + ORmeanL) / 2) / TickSize(), 0) * TickSize()
else Double.NaN;
ORmean.SetStyle(Curve.LONG_DASH);
ORmean.SetLineWeight(3);
ORmean.SetDefaultColor(Color.YELLOW);
def diff = ORmeanH - ORmeanL ;
AddLabel(yes,
text = "orb diff: " + diff,
color = Color.WHITE
);
# End Code ORB for Mobile App
Last edited: