Options Vol/Open Interest For ThinkOrSwim

to be more specific i want to see options where the volume is greater then the open interest and i thought the best way would be to scan for volume divided by open interest ratio and want a minimum of 1.0 or 2.0
 

Join useThinkScript to post your question to a community of 21,000+ developers and traders.

As per image. I already saved the grid and workspace WITHOUT this study, but after clicking on the grid setup, this thing appears again, but only on /ES charts. Is there a way to permanently hide this?

KkLhRMH.png


Separately I got a very simple / silly question on AddLabel. Must it always be linked to a variable, because I simply want to add notes for myself that is not tied to any label?

"testing" on 2ⁿᵈ line doesn't work.

Code:
AddLabel(yes, Concat("A<30, Breakout>8", Round(0)), CreateColor(43, 152, 242));
AddLabel(yes, "testing", Color.BLUE)
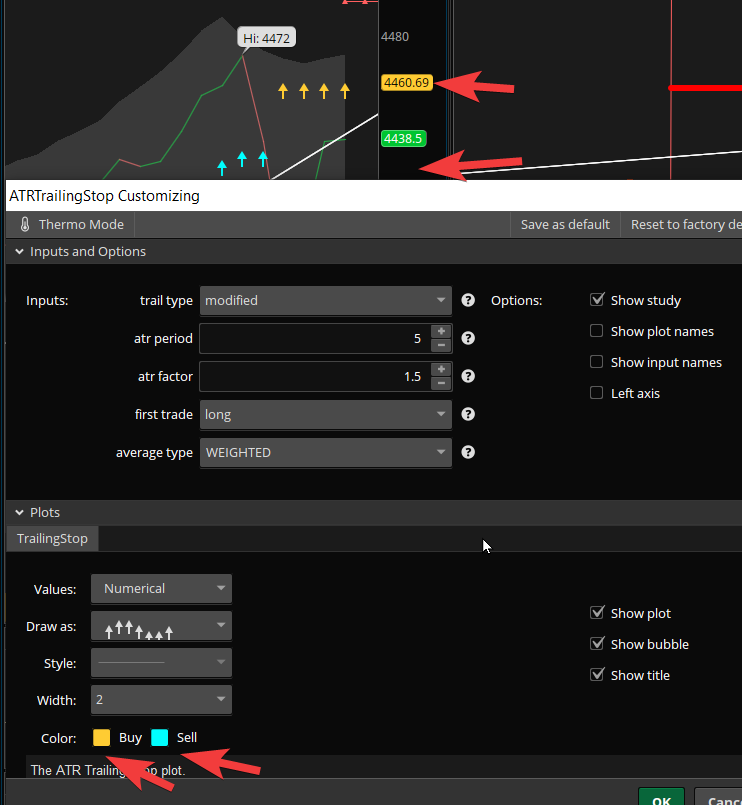
Lastly, I inserted an ATR trailing stop but only the buy bubble is indicated, not sell bubble. how do I make both appear? This issue happens on my pivots too.

p4Eq883.png
 
Last edited:
TOS Open Interest:
The Open Interest is the total number of options or futures contracts that are not closed on a particular day.

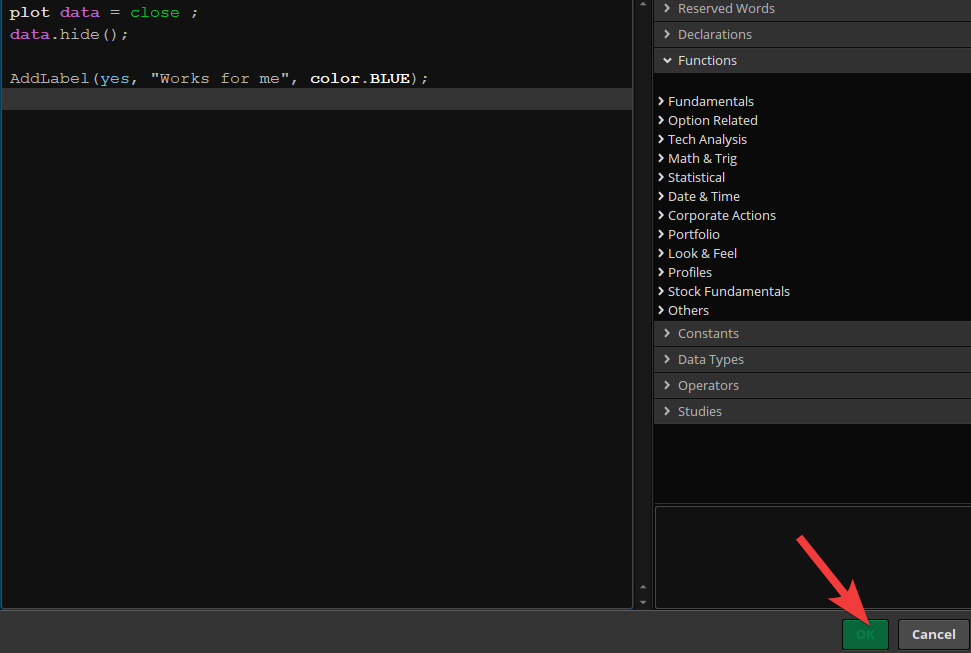
Simple text labels work fine for me:
Screenshot (53).png


The ATR trailing stop bubble is applied to where ever it is on the current candle
Screenshot (54).png
 
I had that problem too.
I selected "overlay volume" and it removes the lower study. It is putting in the upper, but since there is nothing to show, there is nothing there. It saves that way also.
Hope that helps.
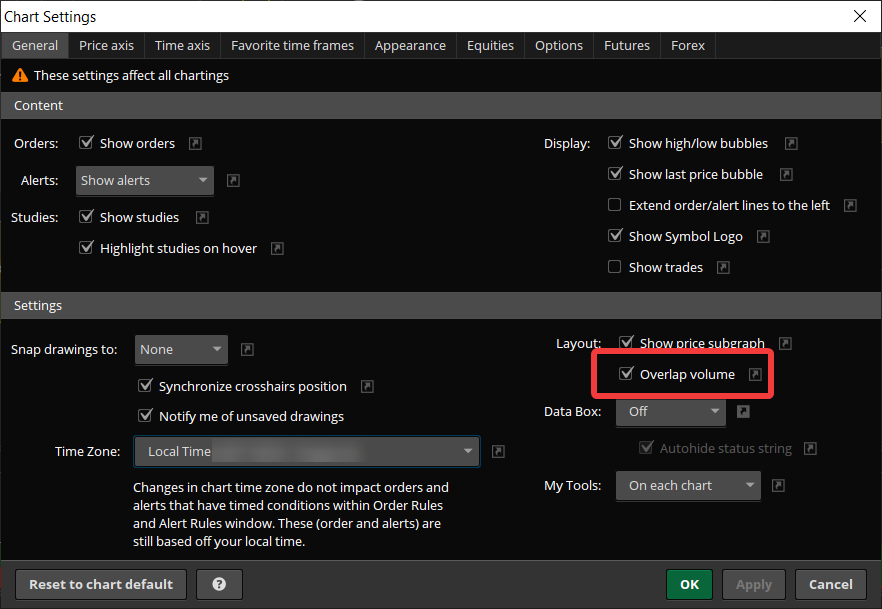
 
@MerryDay, my question wasn't "what is open interest". The problem is that OI wasn't added by me, and it keeps re-appearing no matter how many times I delete the study, and save my grid + workspace + styles + studies. I want to get rid of it permanently.

For the simple labels, I am unable to click OK even though there are no errors:

85e6bA2.png
 
@c0der
If there is no script error, the most common reason for the ok button to be grayed out is if you have an unacceptable name for your study.

For future reference: Posting partial screen grabs makes for difficult troubleshooting.
 
I had that problem too.
I selected "overlay volume" and it removes the lower study. It is putting in the upper, but since there is nothing to show, there is nothing there. It saves that way also.
Hope that helps.
hmm I selected overlay volume but it still shows though:
jOYBtcV.png


@MerryDay you're right, it was the study name. will you have suggestions for the OI issue too?
 
Saw someone on twitter had made an indicator that plots option open interest per strike at their respective price levels on the chart (here are 2 pics of what I assume are 2 different versions) I was wondering if anyone here has the code for this? If anyone knows how to make this that would also be greatly appreciated.


EN2662OW4AMpHau.png

DYQx85_X4AM-4yJ.png
 
I think its nothing but Volume Profile with different approach ... to get the job done plot volume profile on daily chart and compare, I think you would find the same values ..... :unsure:
they import higher aggregation period to daily to plot it .... so the interest range is spread out ... and showing all highest / lowest (accordingly) volume traded in that price range as interest ....
 
Last edited:
Hello,

I was wondering if it was possible to create a script for a scan that would be able to return an increase in open interest. I assume it wouldn't be incredibly in depth as long as you could call on open interest, but I don't really know where to start. Any help would be appreciated!

Thanks
 
I have seen some custom columns for the option chain floating around. Was wondering if anyone has or knows if it possible to show if the volume is buying or selling on the chain as a column? Thanks in advance for any replies!
 
Saw someone on twitter had made an indicator that plots option open interest per strike at their respective price levels on the chart (here are 2 pics of what I assume are 2 different versions) I was wondering if anyone here has the code for this? If anyone knows how to make this that would also be greatly appreciated.


EN2662OW4AMpHau.png

DYQx85_X4AM-4yJ.png
Did You Ever Find this indicator? Where on twitter can i find it?
 

Not the exact question you're looking for?

Start a new thread and receive assistance from our community.

87k+ Posts
346 Online
Create Post

The Market Trading Game Changer

Join 2,500+ subscribers inside the useThinkScript VIP Membership Club
  • Exclusive indicators
  • Proven strategies & setups
  • Private Discord community
  • ‘Buy The Dip’ signal alerts
  • Exclusive members-only content
  • Add-ons and resources
  • 1 full year of unlimited support

Frequently Asked Questions

What is useThinkScript?

useThinkScript is the #1 community of stock market investors using indicators and other tools to power their trading strategies. Traders of all skill levels use our forums to learn about scripting and indicators, help each other, and discover new ways to gain an edge in the markets.

How do I get started?

We get it. Our forum can be intimidating, if not overwhelming. With thousands of topics, tens of thousands of posts, our community has created an incredibly deep knowledge base for stock traders. No one can ever exhaust every resource provided on our site.

If you are new, or just looking for guidance, here are some helpful links to get you started.

What are the benefits of VIP Membership?
VIP members get exclusive access to these proven and tested premium indicators: Buy the Dip, Advanced Market Moves 2.0, Take Profit, and Volatility Trading Range. In addition, VIP members get access to over 50 VIP-only custom indicators, add-ons, and strategies, private VIP-only forums, private Discord channel to discuss trades and strategies in real-time, customer support, trade alerts, and much more. Learn all about VIP membership here.
How can I access the premium indicators?
To access the premium indicators, which are plug and play ready, sign up for VIP membership here.
Back
Top