


AaronPol
New member
Nothing revolutionary. Just the typical options ranking metrics styled in an easier to interpret way. This has served me well by sneaking it in a split screen with Active trader. Chart share: http://tos.mx/!xnKUaqeF
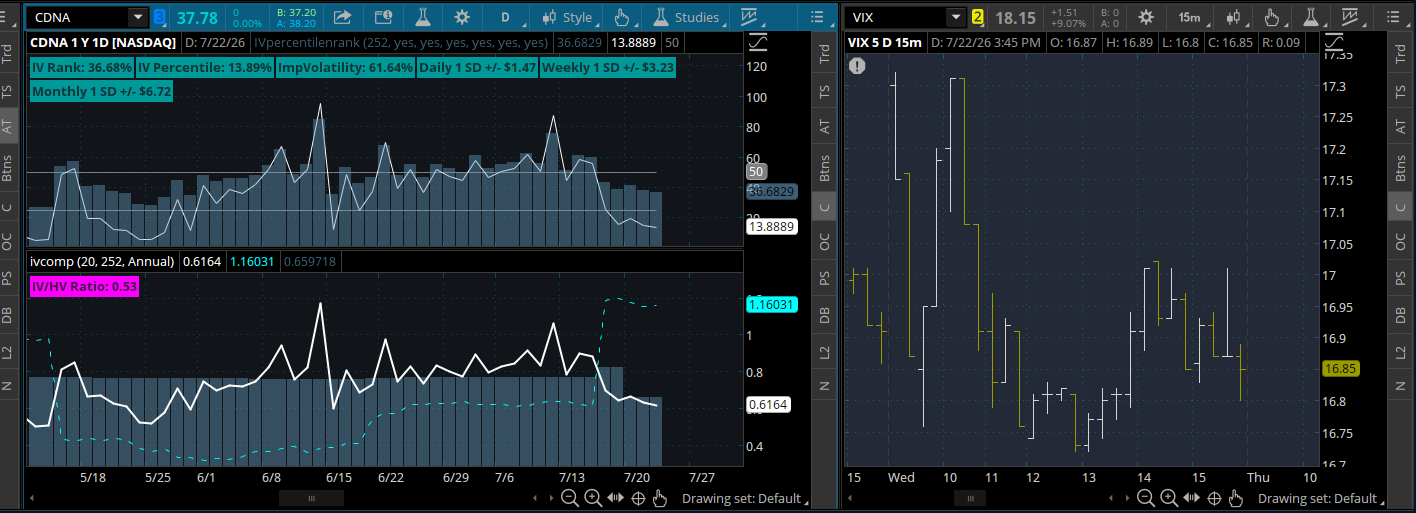
Code:
declare lower;
declare hide_on_intraday;

# Inputs
input TimePeriod = 252;
input DisplayIVRank = yes;
input DisplayIVPercentile = yes;
input DisplayImpVolatility = yes;
input DisplayDaily1StandardDev = yes;
input DisplayWeekly1StandardDev = yes;
input DisplayMonthly1StandardDev = yes;

# Core Volatility Data (Safely ignoring NaN gaps)
def rawVol = imp_volatility();
def vol = if !isNaN(rawVol) then rawVol else vol[1];

# Determine if current bar actually has valid market data
def hasData = !isNaN(close) and !isNaN(rawVol);

# 1. IV Rank Calculation
def hi = highest(vol, TimePeriod);
def lo = lowest(vol, TimePeriod);
def RawIVRank = if (hi - lo) != 0 then ((vol - lo) / (hi - lo)) * 100 else 0;

# 2. IV Percentile Calculation
def DaysBelow = fold i = 0 to TimePeriod with count = 0 do if vol > getValue(vol, i) then count + 1 else count;
def RawIVPercentile = (DaysBelow / TimePeriod) * 100;

# Mask plots so they ONLY render on valid data bars (eliminates the trailing flat line)
plot RankPlot = if hasData then Max(0, Min(100, RawIVRank)) else Double.NaN;
plot PercentilePlot = if hasData then Max(0, Min(100, RawIVPercentile)) else Double.NaN;

plot LowVolThreshold = if hasData then 25 else Double.NaN;
plot HighVolThreshold = if hasData then 50 else Double.NaN;

RankPlot.SetDefaultColor(Color.CYAN);
PercentilePlot.SetDefaultColor(Color.MAGENTA);
LowVolThreshold.SetDefaultColor(Color.GRAY);
HighVolThreshold.SetDefaultColor(Color.GRAY);

# Dynamic Color Logic
def lowend = RawIVRank < 25;
def highend = RawIVRank > 50;

DefineGlobalColor("LowVol", Color.RED);
DefineGlobalColor("NormalVol", Color.YELLOW);
DefineGlobalColor("HighVol", Color.GREEN);

# Labels
addlabel(DisplayIVRank and hasData, concat("IV Rank: ", aspercent(RawIVRank / 100)), if lowend then GlobalColor("LowVol") else if highend then GlobalColor("HighVol") else GlobalColor("NormalVol"));

addlabel(DisplayIVPercentile and hasData, concat("IV Percentile: ", aspercent(RawIVPercentile / 100)), if lowend then GlobalColor("LowVol") else if highend then GlobalColor("HighVol") else GlobalColor("NormalVol"));

addlabel(DisplayImpVolatility and hasData, concat("ImpVolatility: ", aspercent(vol)), if lowend then GlobalColor("LowVol") else if highend then GlobalColor("HighVol") else GlobalColor("NormalVol"));

# Expected Moves
def ImpPts = (vol / Sqrt(252)) * close;
AddLabel(DisplayDaily1StandardDev and hasData, Concat("Daily 1 SD +/- $", Astext(ImpPts, NumberFormat.TWO_DECIMAL_PLACES)), if lowend then GlobalColor("LowVol") else if highend then GlobalColor("HighVol") else GlobalColor("NormalVol"));

def ImpPts2 = (vol / Sqrt(52)) * close;
AddLabel(DisplayWeekly1StandardDev and hasData, Concat("Weekly 1 SD +/- $", Astext(ImpPts2, NumberFormat.TWO_DECIMAL_PLACES)), if lowend then GlobalColor("LowVol") else if highend then GlobalColor("HighVol") else GlobalColor("NormalVol"));

def ImpPts3 = (vol / Sqrt(12)) * close;
AddLabel(DisplayMonthly1StandardDev and hasData, Concat("Monthly 1 SD +/- $", Astext(ImpPts3, NumberFormat.TWO_DECIMAL_PLACES)), if lowend then GlobalColor("LowVol") else if highend then GlobalColor("HighVol") else GlobalColor("NormalVol"));
Code:
# Cleaned IV vs. HV Study with Global Colors (No Red/Green)
declare lower;
declare hide_on_intraday;

# Calculation Inputs
input length20 = 20;
input length252 = 252;
input basis = {default Annual, Monthly, Weekly, Daily};

def ap = getAggregationPeriod();
Assert(ap >= AggregationPeriod.MIN, "Study can only be calculated for time-aggregated charts: " + ap);

def barsPerDay = (RegularTradingEnd(getYyyyMmDd()) - RegularTradingStart(getYyyyMmDd())) / ap;
def barsPerYear =
    if ap > AggregationPeriod.WEEK then 12
    else if ap == AggregationPeriod.WEEK then 52
    else if ap >= AggregationPeriod.DAY then 252 * AggregationPeriod.DAY / ap
    else 252 * barsPerDay;

def basisCoeff;
switch (basis) {
    case Annual:
        basisCoeff = 1;
    case Monthly:
        basisCoeff = 12;
    case Weekly:
        basisCoeff = 52;
    case Daily:
        basisCoeff = 252;
}

def clLog = log(close / close[1]);

# Volatility Calculations
def rawImpVol = IMP_VOLATILITY();
def vol = if !isNaN(rawImpVol) then rawImpVol else vol[1];
def hv20 = stdev(clLog, length20) * Sqrt(barsPerYear / basisCoeff * length20 / (length20 - 1));
def hv252 = stdev(clLog, length252) * Sqrt(barsPerYear / basisCoeff * length252 / (length252 - 1));

# IV / HV Ratio (Comparing IV against 20-day HV)
def ivHvRatio = if hv20 > 0 then vol / hv20 else 0;

# Plots
plot impVolLine = if !isNaN(close) and !isNaN(rawImpVol) then rawImpVol else Double.NaN;
plot histVol20 = if !isNaN(close) then hv20 else Double.NaN;
plot histVol252 = if !isNaN(close) then hv252 else Double.NaN;

impVolLine.SetDefaultColor(Color.WHITE);
impVolLine.SetLineWeight(2);

histVol20.SetDefaultColor(Color.CYAN);
histVol20.SetLineWeight(1);

histVol252.SetDefaultColor(Color.YELLOW);
histVol252.SetLineWeight(1);

# Define Static Global Colors (Cyan for High, Gray for Normal, Magenta for Low)
DefineGlobalColor("HighRatio", Color.CYAN);
DefineGlobalColor("NormalRatio", Color.GRAY);
DefineGlobalColor("LowRatio", Color.MAGENTA);

# Dynamic Color Ratio Label
AddLabel(yes, Concat("IV/HV Ratio: ", Astext(ivHvRatio, NumberFormat.TWO_DECIMAL_PLACES)),
    if ivHvRatio >= 1.25 then GlobalColor("HighRatio")
    else if ivHvRatio < 1.0 then GlobalColor("LowRatio")
    else GlobalColor("NormalRatio")
);
