Options Gamma Study For ThinkOrSwim

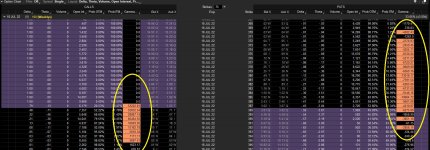
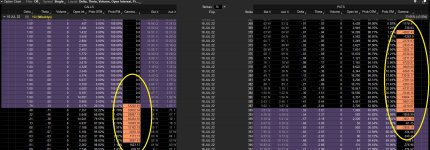
Would it be possible to take the code below that I have on the options chain and build a lower study that would show the change in gamma for the highlighted Strikes for 0DTE? Even if I had to change the date each day in the code to get it to pull the data? I would want this for SPX and SPY so I could see change in gamma on the chart without having to open up the options chain. I view this every day to get an idea of the gamma wall that may be support or resistance. What I have noticed is that on the SPX if gamma is call heavy then it most likely goes up and those strikes are ITM at end of day. And on SPY just the opposite. Seems to be more of a contrarian indicator on SPY and a direction on SPX. But only 0DTE matters.

CODE
# Gamma Exposure at each strike is calculated by the formula option gamma * open interest * 100 (calls, x-100 for puts)

plot data = if IsPut() then gamma() * -100 * open_interest() else gamma() * 100 * open_interest();
assignbackgroundcolor(if AbsValue(data) > 2000 then createcolor(250,150,100) else color.black);
data.assignvaluecolor(if AbsValue(data) > 2000 then color.black else color.current);
15176[/ATTACH]']
Ua5aYVo.jpg
 

Attachments

  • Ua5aYVo.jpg
    Ua5aYVo.jpg
    448.8 KB · Views: 1,603
Would it be possible to take the code below that I have on the options chain and build a lower study that would show the change in gamma for the highlighted Strikes for 0DTE? Even if I had to change the date each day in the code to get it to pull the data? I would want this for SPX and SPY so I could see change in gamma on the chart without having to open up the options chain. I view this every day to get an idea of the gamma wall that may be support or resistance. What I have noticed is that on the SPX if gamma is call heavy then it most likely goes up and those strikes are ITM at end of day. And on SPY just the opposite. Seems to be more of a contrarian indicator on SPY and a direction on SPX. But only 0DTE matters.

CODE
# Gamma Exposure at each strike is calculated by the formula option gamma * open interest * 100 (calls, x-100 for puts)

plot data = if IsPut() then gamma() * -100 * open_interest() else gamma() * 100 * open_interest();
assignbackgroundcolor(if AbsValue(data) > 2000 then createcolor(250,150,100) else color.black);
data.assignvaluecolor(if AbsValue(data) > 2000 then color.black else color.current);
15217[/ATTACH]']
Ua5aYVo.jpg
does this code still works for you?! because its giving me NaN results
 

Attachments

  • Ua5aYVo.jpg
    Ua5aYVo.jpg
    448.8 KB · Views: 394
It does work for me. Did you go to layout, customize, open one of the custom tabs and add it to thinkscript editor? I use it every day. But mostly on SPX and it shows the most likely direction of the market on 0DTE.
I did exactly that. I even tried to change time frames, still nothing, tried to change gamma() to optiongamma(), still nothing. Is your time frame set to D? This is super frustrating :/ and I am very good with codes, I am not new to Tos nor coding in Tos...ugh
 
I did exactly that. I even tried to change time frames, still nothing, tried to change gamma() to optiongamma(), still nothing. Is your time frame set to D? This is super frustrating :/ and I am very good with codes, I am not new to Tos nor coding in Tos...ugh
Under Condition Wizard before you click over to thinkScript Editor did you delete the default SimpleMovingAvg ?
 
I did exactly that. I even tried to change time frames, still nothing, tried to change gamma() to optiongamma(), still nothing. Is your time frame set to D? This is super frustrating :/ and I am very good with codes, I am not new to Tos nor coding in Tos...ugh
I would also restart TOS. I had a friend on discord who had a problem getting it to work. I think he did finally get it to work.
 
I don't have anything there. I attached a screenshot. Let me know if your code looks the same? This is SPX option chain for today.

https%3A//i.imgur.com/kUbf6ko.jpg[/img]']
kUbf6ko.jpg
Its possible that it wont work till tomorrow open. Not sure it will pull data after close. Because it only updates after the open and through the day. Everything looks right. I'm no code guy. Wish I was. I want to have 3 levels colored yellow, orange and red. The > than 2000 is great for SPX but on SPY you need > 100000 and > 200000. I use it as a way to sell options. So right now I have three columns on my chain. It works but not a clean as I would like.
 
Can someone post the actual code that works...I can't get the link to work
Thank you very much
put this code in, it works....and if it doesn't work today, it will work on Monday. Mine started to work at 1am this morning prior to that it would give me NaN results. I named it "gammaQ" lol (if I will give you a link, it will not show in option's chain study and it will only appear in "regular" watchlist (which is pointless) ...so the only option you have is copy and paste it yourself).

#Code:

plot data = if IsPut() then gamma() * -100 * open_interest() else gamma() * 100 * open_interest();
assignbackgroundcolor(if AbsValue(data) > 2000 then color.orange else color.black);
data.assignvaluecolor(if AbsValue(data) > 2000 then color.black else color.current);
Thank you very much I finally got it working
 
Thank you for sharing this. It works for me.

Any tips on how to use it for trading SPX 0DTE verticals and iron condors?
The side that lights up OTM is the direction of the market that day. But if I see the market open with Deep ITM on either side they are prob selling spreads. Today the Put side is heavy and down it went. Compare to SPY and look for max pain on SPY. IMO they dont want to pay SPY. Big boys are trading SPX.
 
The side that lights up OTM is the direction of the market that day. But if I see the market open with Deep ITM on either side they are prob selling spreads. Today the Put side is heavy and down it went. Compare to SPY and look for max pain on SPY. IMO they dont want to pay SPY. Big boys are trading SPX.
Do you happen to have a screenshot of the explanation you gave....please forgive me i'm just trying to get a clear image in my mind
 
I am not able to get it to work. Need detailed explanation of exactly how and where to place the code; please.

Click on the Trade tab. Enter or select SPX in the Quote.

On the Option Chain row click Layout, then Customize.

Double-click to open any of the Custom, then change the Column name to what you want.

Click on the thinkScript Editor tab. Click in the area where the existing code is, then select all of the code with Ctrl +A, then press the Delete key. Now paste in the new code.

Click Apply, then OK.
 

Join useThinkScript to post your question to a community of 21,000+ developers and traders.

Similar threads

Not the exact question you're looking for?

Start a new thread and receive assistance from our community.

87k+ Posts
184 Online
Create Post

Similar threads

Similar threads

The Market Trading Game Changer

Join 2,500+ subscribers inside the useThinkScript VIP Membership Club
  • Exclusive indicators
  • Proven strategies & setups
  • Private Discord community
  • ‘Buy The Dip’ signal alerts
  • Exclusive members-only content
  • Add-ons and resources
  • 1 full year of unlimited support

Frequently Asked Questions

What is useThinkScript?

useThinkScript is the #1 community of stock market investors using indicators and other tools to power their trading strategies. Traders of all skill levels use our forums to learn about scripting and indicators, help each other, and discover new ways to gain an edge in the markets.

How do I get started?

We get it. Our forum can be intimidating, if not overwhelming. With thousands of topics, tens of thousands of posts, our community has created an incredibly deep knowledge base for stock traders. No one can ever exhaust every resource provided on our site.

If you are new, or just looking for guidance, here are some helpful links to get you started.

What are the benefits of VIP Membership?
VIP members get exclusive access to these proven and tested premium indicators: Buy the Dip, Advanced Market Moves 2.0, Take Profit, and Volatility Trading Range. In addition, VIP members get access to over 50 VIP-only custom indicators, add-ons, and strategies, private VIP-only forums, private Discord channel to discuss trades and strategies in real-time, customer support, trade alerts, and much more. Learn all about VIP membership here.
How can I access the premium indicators?
To access the premium indicators, which are plug and play ready, sign up for VIP membership here.
Back
Top