Opening Range Breakout with Directional Day Filter for ThinkorSwim

BenTen

Administrative
Staff member
Staff
VIP
Lifetime
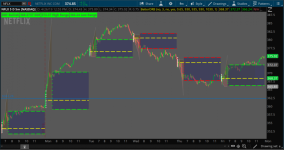
Another version of the ORB for ThinkorSwim but with Directional Day Filter to help predict the trend for the day. In addition to that, the developer also added cumulative volume and accumulation ratio.

Here is the note regarding this version of Opening Range Breakout.

  • If the majority of the activity is above the Directional Day Filter Line the trend bias for the day will be higher.
  • If the majority of the activity is below the Directional Day Filter Line the trend bias for the day will be lower.
  • If it's even the day will most likely be flat.
  • If the closing bar on the Time Line is within 1/3 the distance from the Directional Day Filter Line then added bias can be anticipated.

jmuFWTN.png


thinkScript Code

Rich (BB code):
# DDF_R3V5

# Written by KumoBob - aka Bob Campbell
# http://fibonacci-financial.blogspot.com/

# R1V1 2010.01.25
# Wrote DDF
# R2V1 2010.04.01
# Combined Companion DDF with DDF
# R2V3 2010.04.09
# Changed color of tflow and tfhigh to gray
# R2V4 2010.06.01
# Resizing of the cumulative volume cloud
# R2V5 2010.06.08:08:45
# Begin star date
# Added accumulation ratio
# Added alert
# R3V1 2010.06.15:17:00
# Added Fill for the entire day as an option.
# R3V2 2010.06.15:22:00
# Fixed Fill for the entire day as an option.
# R3V3 Removed center plot when not aggregate
# R3V4 2010.06.20:18:00
# Added ChartBubbles
# R3V5 2010.06.21:22:00
# Changed end of highlight

# for more info go to http://www.clayburg.com/jfc_directional_day_filter_indic.htm

#hint:DDF_Accmulation_Companion Study, Best used in a 1 to 5 minute chart period

# Clayburgs Directional Day Filter
# Written by KumoBob Dec 31 2009
#
# Thanks to ThinkScriptor and aPPLE_PI for helping me with the secondsfromtime() function by showing me the code writen by Prospectus in his Opening Range study.


# Directional Day Filter Line - After the first five minutes calculate the average range for this 5-minute bar. Draw a horizontal line at this level.
# Time Line - Draw a vertical line at 60-minute bar (Low to High of the day so far).
# (slower value for faster moving charts like currency and S&P – Faster value for slower moving charts) (45 minutes to 90 minutes)
# Determine the amount of activity above and below the Directional Day Filter Line prior to the Time Line.
# (A rectangle can be drawn with Blue shading above and Red below the Directional Day Filter Line)
# If the majority of the activity is above the Directional Day Filter Line the trend bias for the day will be higher.
# If the majority of the activity is below the Directional Day Filter Line the trend bias for the day will be lower.
# If it's even the day will most likely be flat.
# If the closing bar on the Time Line is within 1/3 the distance from the Directional Day Filter Line then added bias can be anticipated.


# ______________________________________________________________
# Thinkscript is the property of ThinkorSwim and TDAmeritrade
# Sections of this script may have been copied or modified from
# one or more Thinkscript studies in part or in their entirety.
# ______________________________________________________________
input BubblesOn = Yes;
input ReduceVolumeCloud = 3;
def na = Double.NaN;
############### Directional Day Filter Line ##############


input ShowTodayOnly = Yes;

input FillDay = Yes;
input PCT = 0.65;
input ORBegin = 0930;
input OREnd = 0935;
# ________ Aggregation Alter _________


def aggregation5 = if GetAggregationPeriod() == (AggregationPeriod.MIN * 5) then 1 else 0;
def aggregation1 = if GetAggregationPeriod() == (AggregationPeriod.MIN) then 1 else 0;
def aggregation = if aggregation1 or aggregation5 then 1 else 0;


#input Color_Price ={"Yes" ,default "no" };

# Create logic for OR definition: 1 if between fist 5 minutes
def ORActive = if SecondsTillTime(OREnd) > 0 and SecondsFromTime(ORBegin) >= 0 then 1 else 0;
# Create logic to paint only current day post-open:
def today = if !ShowTodayOnly or GetDay() == GetLastDay() and SecondsFromTime(ORBegin) >= 0 then 1 else 0;
# Track OR High:
rec ORHigh = if ORHigh[1] == 0 or ORActive[1] == 0 and ORActive == 1 then high else if ORActive and high > ORHigh[1] then high else ORHigh[1];
# Track OR Low:
rec ORLow = if ORLow[1] == 0 or ORActive[1] == 0 and ORActive == 1 then low else if ORActive and low < ORLow[1] then low else ORLow[1];
# Calculate OR width:
def ORWidth = ORHigh - ORLow;
# Define all the plots:
def ORHA = if ORActive or today < 1 then na else ORHigh;
def ORLA = if !aggregation or ORActive or today < 1 then na else ORLow;
def O = ORHA - (ORHA - ORLA) / 2;
plot ORL = if !aggregation or O == 0 then na else O;
ORL.SetDefaultColor(Color.YELLOW);
ORL.SetStyle(Curve.LONG_DASH);
ORL.SetLineWeight(3);

################## Time Line #####################

input ORBegin2 = 0930;
# Define time that OR is finished (in hhmm format,
# 10:00 is the default):
input OREnd2 = 1030;
# Show Today only? (Default Yes)
####input ShowTodayOnly={"No", default "Yes"};
####def s=ShowTodayOnly;
# Create logic for OR definition:
def ORActive2 = if SecondsTillTime(OREnd2) > 0 and SecondsFromTime(ORBegin2) >= 0 then 1 else 0;
# Create logic to paint only current day post-open:
#####def today=if s==0 OR getday()==getlastday() AND secondsfromtime(ORBegin2)>=0 then 1 else 0;
# Track OR High:
rec ORHigh2 = if ORHigh2[1] == 0 or ORActive2[1] == 0 and ORActive2 == 1 then high else if ORActive2 and high > ORHigh2[1] then high else ORHigh2[1];
# Track OR Low:
rec ORLow2 = if ORLow2[1] == 0 or ORActive2[1] == 0 and ORActive2 == 1 then low else if ORActive2 and low < ORLow2[1] then low else ORLow2[1];
# Calculate OR width:
def ORWidth2 = ORHigh2 - ORLow2;
# Define all the plots:
plot ORH2 = if !aggregation or ORActive2 or today < 1 then na else ORHigh2;
plot ORL2 = if !aggregation or ORActive2 or today < 1 then na else ORLow2;
# ChartBubbles added Version_6 20100620:17:00

AddChartBubble(BubblesOn && IsNaN(close), ORH2[1], Concat("DDF High ", ORH2[1]), Color.WHITE, yes);
AddChartBubble(BubblesOn && IsNaN(close), O[1], Concat("DDF ", O[1]), Color.WHITE, no);
AddChartBubble(BubblesOn && IsNaN(close), ORL2[1], Concat("DDF Low ", ORL2[1]), Color.WHITE, no);

ORL.HideBubble();
ORL2.HideBubble();
ORH2.HideBubble();


# Formatting:
ORH2.SetDefaultColor(Color.GREEN);
ORH2.SetStyle(Curve.LONG_DASH);
ORH2.SetLineWeight(3);
ORL2.SetDefaultColor(Color.RED);
ORL2.SetStyle(Curve.LONG_DASH);
ORL2.SetLineWeight(3);

################################
def TimeLine = if SecondsTillTime(OREnd2) == 0 then 1 else 0;

def pos = (ORH2 - ORL2) / 10;

plot d1 = If (TimeLine , ORH2, na);
plot d2 = If (TimeLine , ORH2 - ( pos * 2), na);
plot d3 = If (TimeLine , ORH2 - ( pos * 3), na);
plot d4 = If (TimeLine , ORH2 - ( pos * 4), na);
plot d5 = If (TimeLine , ORH2 - ( pos * 5), na);
plot d6 = If (TimeLine , ORH2 - ( pos * 6), na);
plot d7 = If (TimeLine , ORH2 - ( pos * 7), na);
plot d8 = If (TimeLine , ORH2 - ( pos * 8), na);
plot d9 = If (TimeLine , ORH2 - ( pos * 9), na);
plot d10 = If (TimeLine , (ORL2), na);

d1.SetPaintingStrategy(PaintingStrategy.ARROW_DOWN);
d2.SetPaintingStrategy(PaintingStrategy.POINTS);
d3.SetPaintingStrategy(PaintingStrategy.POINTS);
d4.SetPaintingStrategy(PaintingStrategy.POINTS);
d5.SetPaintingStrategy(PaintingStrategy.POINTS);
d6.SetPaintingStrategy(PaintingStrategy.POINTS);
d7.SetPaintingStrategy(PaintingStrategy.POINTS);
d8.SetPaintingStrategy(PaintingStrategy.POINTS);
d9.SetPaintingStrategy(PaintingStrategy.POINTS);
d10.SetPaintingStrategy(PaintingStrategy.ARROW_UP);


def Span = (O - ORL2) / (ORH2 - ORL2);
rec colorState = if Span > PCT then -1
else if Span < 1 - PCT then 1 else 0; # Percent above or below yellow line


d1.AssignValueColor(Color.WHITE);
d2.AssignValueColor(if colorState < 0 then Color.RED else if colorState > 0 then Color.GREEN else Color.YELLOW);

d3.AssignValueColor(if colorState < 0 then Color.RED else if colorState > 0 then Color.GREEN else Color.YELLOW);

d4.AssignValueColor(if colorState < 0 then Color.RED else if colorState > 0 then Color.GREEN else Color.YELLOW);

d5.AssignValueColor(if colorState < 0 then Color.RED else if colorState > 0 then Color.GREEN else Color.YELLOW);

d6.AssignValueColor(if colorState < 0 then Color.RED else if colorState > 0 then Color.GREEN else Color.YELLOW);

d7.AssignValueColor(if colorState < 0 then Color.RED else if colorState > 0 then Color.GREEN else Color.YELLOW);

d8.AssignValueColor(if colorState < 0 then Color.RED else if colorState > 0 then Color.GREEN else Color.YELLOW);

d9.AssignValueColor(if colorState < 0 then Color.RED else if colorState > 0 then Color.GREEN else Color.YELLOW);
## I removed the color logic for d1 and d10 because it could be confused with PPS.
d10.AssignValueColor(Color.WHITE);


input Dot_Size = 1;
d1.SetLineWeight(Dot_Size);
d2.SetLineWeight(Dot_Size);
d3.SetLineWeight(Dot_Size);
d4.SetLineWeight(Dot_Size);
d5.SetLineWeight(Dot_Size);
d6.SetLineWeight(Dot_Size);
d7.SetLineWeight(Dot_Size);
d8.SetLineWeight(Dot_Size);
d9.SetLineWeight(Dot_Size);
d10.SetLineWeight(Dot_Size);

#######################################################################


def TimeLineb = if SecondsTillTime(OREnd) == 0 then 1 else 0;

def posbd = (ORHA - ORLA) / 10;

plot bd1 = If (TimeLineb , ORHA, na);
plot bd2 = If (TimeLineb , ORHA - ( posbd * 2), na);
plot bd3 = If (TimeLineb , ORHA - ( posbd * 3), na);
plot bd4 = If (TimeLineb , ORHA - ( posbd * 4), na);
plot bd5 = If (TimeLineb , ORHA - ( posbd * 5), na);
plot bd6 = If (TimeLineb , ORHA - ( posbd * 6), na);
plot bd7 = If (TimeLineb , ORHA - ( posbd * 7), na);
plot bd8 = If (TimeLineb , ORHA - ( posbd * 8), na);
plot bd9 = If (TimeLineb , ORHA - ( posbd * 9), na);
plot bd10 = If (TimeLineb , (ORL2), na);

bd1.SetPaintingStrategy(PaintingStrategy.POINTS);
bd2.SetPaintingStrategy(PaintingStrategy.POINTS);
bd3.SetPaintingStrategy(PaintingStrategy.POINTS);
bd4.SetPaintingStrategy(PaintingStrategy.POINTS);
bd5.SetPaintingStrategy(PaintingStrategy.POINTS);
bd6.SetPaintingStrategy(PaintingStrategy.POINTS);
bd7.SetPaintingStrategy(PaintingStrategy.POINTS);
bd8.SetPaintingStrategy(PaintingStrategy.POINTS);
bd9.SetPaintingStrategy(PaintingStrategy.POINTS);
bd10.SetPaintingStrategy(PaintingStrategy.POINTS);

bd1.SetDefaultColor(Color.WHITE);
bd2.SetDefaultColor(Color.WHITE);
bd3.SetDefaultColor(Color.WHITE);
bd4.SetDefaultColor(Color.WHITE);
bd5.SetDefaultColor(Color.WHITE);
bd6.SetDefaultColor(Color.WHITE);
bd7.SetDefaultColor(Color.WHITE);
bd8.SetDefaultColor(Color.WHITE);
bd9.SetDefaultColor(Color.WHITE);
bd10.SetDefaultColor(Color.WHITE);


ORL2.AssignValueColor(
if colorState < 0 then Color.RED else
if colorState > 0 then Color.GREEN else
Color.YELLOW);
ORH2.AssignValueColor(
if colorState < 0 then Color.RED else
if colorState > 0 then Color.GREEN else
Color.YELLOW);

AddCloud(ORL2, ORH2, CreateColor(010, 010, 010), CreateColor(010, 010, 0100));

d2.HideBubble();
d3.HideBubble();
d4.HideBubble();
d5.HideBubble();
d6.HideBubble();
d7.HideBubble();
d8.HideBubble();
d9.HideBubble();


bd1.HideBubble();
bd2.HideBubble();
bd3.HideBubble();
bd4.HideBubble();
bd5.HideBubble();
bd6.HideBubble();
bd7.HideBubble();
bd8.HideBubble();
bd9.HideBubble();
bd10.HideBubble();
############### Directional Day Filter Line ##############


################## Time Line ##################


#AddCloud(ORL2, ORH2, color.green, color.green);
################################################

def Width = ORHigh - ORLow;
def H = if ORActive or today < 1 then 0 else ORHigh;
def L = if ORActive or today < 1 then 0 else ORLow;
def center = H - (H - L) / 2;
#############################################

#plot test = if high > center then center +10 else center - 10;;
rec theHigh = if high > center and center > 0 then high - center else 0;
rec sumH = if sumH[1] == 0 and center > 0 then theHigh else if center == 0 then 0 else theHigh + sumH[1];
#plot tfhigh = if (center > 0 , sumH + center, double.nan);
plot tfhigh = If (ORActive2 == 1 and center > 0 , (sumH / ReduceVolumeCloud) + center, Double.NaN);
rec theLow = if low < center and center > 0 then low - center else 0;
rec sumL = if sumL[1] == 0 and center > 0 then theLow else if center == 0 then 0 else theLow + sumL[1];
plot tflow = If (ORActive2 == 1 and center > 0 , (sumL / ReduceVolumeCloud) + center, Double.NaN);
plot zero = If (ORActive2 == 1 and center > 0 , center, Double.NaN);
tflow.SetDefaultColor(Color.GRAY);
tfhigh.SetDefaultColor(Color.GRAY);
AddCloud(tflow , zero, CreateColor(0, 0, 0), CreateColor(190, 90, 90));
AddCloud(tfhigh , zero, CreateColor(090, 65, 20), CreateColor(090, 65, 20));


#rec cum = if timeline then tflow/tfhigh else 2;# cum[1] ;
rec cum = if ORActive && TimeLine then tflow / tfhigh else cum ;


AddLabel(yes, if colorState < 0 then "DDF Bearish" else if colorState > 0 then "DDF Bullish" else "DDF Neutral", if colorState < 0 then Color.RED else if colorState > 0 then Color.GREEN else Color.YELLOW);
#AddChartLabel(yes, if colorState < 0 then "DDF Bearish" else if colorState > 0 then "DDF Bullish" else "DDF Neutral",if colorState < 0 then Color.RED else if colorState > 0 then Color.GREEN else Color.Yellow);
AddLabel(yes, Concat( center, Concat(" ", if colorState < 0 then "DDF" else if colorState > 0 then "DDF" else "DDF ")), (if colorState < 0 then Color.RED else if colorState > 0 then Color.GREEN else Color.YELLOW));
#AddChartLabel(yes, concat( center, concat(" ", if colorState < 0 then "Center - DDF Bearish" else if colorState > 0 then "Center - DDF Bullish" else "Center - DDF Neutral")),(if colorState < 0 then Color.RED else if colorState > 0 then Color.GREEN else Color.Yellow));

AddLabel(yes, Concat( ORH2, Concat(" ", if colorState < 0 then "High Range" else if colorState > 0 then "High Range" else "High Range")), (if colorState < 0 then Color.RED else if colorState > 0 then Color.GREEN else Color.YELLOW));
AddLabel(yes, Concat( ORL2, Concat(" ", if colorState < 0 then "Low Range" else if colorState > 0 then "Low Range" else "Low Range")), (if colorState < 0 then Color.RED else if colorState > 0 then Color.GREEN else Color.YELLOW));

#AddChartLabel(yes, concat( ORH2, concat(" ", if colorState < 0 then "High Range" else if colorState > 0 then "High Range" else "High Range")),(if colorState < 0 then Color.RED else if colorState > 0 then Color.GREEN else Color.Yellow));
#AddChartLabel(yes, concat( ORL2, concat(" ", if colorState < 0 then "Low Range" else if colorState > 0 then "Low Range" else "Low Range")),(if colorState < 0 then Color.RED else if colorState > 0 then Color.GREEN else Color.Yellow));


#AddChartLabel(yes, concat( center, concat(" ", "Center")));

# ____________________________________
# _______________ Alert ______________
# ____________________________________

input SoundType = {Ring, Ding, Chimes, Bell, default NoSound};

def type;
switch (SoundType){
case Ring:
    type = 1;
case Ding:
    type = 2;
case Chimes:
    type = 3;
case Bell:
    type = 4;
case NoSound:
    type = 5;
}

def range = if high() < ORHigh2 and low > ORLow2 then 0 else 1;

Alert(range and type == 1 , "Range Alert", Alert.BAR, Sound.Ring);
Alert(range and type == 2 , "Range Alert", Alert.BAR, Sound.Ding);
Alert(range and type == 3 , "Range Alert", Alert.BAR, Sound.Chimes);
Alert(range and type == 4 , "Range Alert", Alert.BAR, Sound.Bell);
Alert(range and type == 5 , "Range Alert", Alert.BAR, Sound.NoSound);

AddLabel(yes, if type == 5 then "Alert OFF" else if type == 1 then "Alert Ring" else if type == 2 then "Alert Ding" else if type == 3 then "Alert Chimes" else "Alert Bell" , if colorState < 0 then Color.RED else if colorState > 0 then Color.GREEN else Color.YELLOW);
#AddChartLabel(yes, if type == 5 then "Alert OFF" else if type == 1 then "Alert Ring" else if type == 2 then "Alert Ding" else if type == 3 then "Alert Chimes" else "Alert Bell" ,if colorState < 0 then Color.RED else if colorState > 0 then Color.GREEN else Color.Yellow);

# Delete ### AddChartLabel(yes, if type != 5 then "Alter ON" else "Alert OFF",color.white);
# ============================================


# +++++++++++++++++++++++++++++++++++++++++++++++++++


def today2 = if GetDay()[1] == GetLastDay() and SecondsFromTime(1030) >= 0 then 1 else 0;
def PlotThisPeriod = if GetDay() == GetLastDay() &&
SecondsFromTime(1030) >= 0 &&
SecondsTillTime(1430) >= 0
then 1 else 0;
def PeriodIsActive = if SecondsFromTime(0930) >= 0 && SecondsTillTime(1030) >= 0 then 1 else 0;

def FillPeriod = if SecondsFromTime(1030) >= 0 && SecondsTillTime(1430) >= 0 && GetDay() == GetLastDay() then 1 else 0;

rec PeriodHigh = if PeriodIsActive && high > PeriodHigh[1] then high else PeriodHigh[1] ;
rec HighAlert = if PeriodIsActive then PeriodHigh else HighAlert[1] ;

rec PeriodLow = if PeriodIsActive && low < PeriodLow[1] or SecondsFromTime(0930) == 0 then low else PeriodLow[1] ;
rec LowAlert = if PeriodIsActive then PeriodLow else LowAlert[1] ;
rec keepORH2 = if SecondsFromTime(1030) == 0 then ORH2 else keepORH2[1];
rec keepORL2 = if SecondsFromTime(1030) == 0 then ORL2 else keepORL2[1];
plot hg = if !FillPeriod then Double.NaN else keepORH2;
plot lo = if !FillPeriod then Double.NaN else keepORL2;
hg.SetDefaultColor( Color.DARK_GRAY);
lo.SetDefaultColor( Color.DARK_GRAY);
hg.SetLineWeight(1);
lo.SetLineWeight(1);
#plot hg = if !aggregation or !FillPeriod or !FillDay then double.nan else ORH2;
#plot lo = if !aggregation or !PlotThisPeriod or !FillDay then double.nan else If PeriodIsActive then LowAlert else LowAlert[1];
#AddCloud(hg, lo, CreateColor(025, 25, 112) );
AddCloud(hg, lo, Color.DARK_GRAY);

ORL.HideBubble();

Shareable Link

https://tos.mx/LczSGD

You may also like

Credit:
 

Attachments

  • jmuFWTN.png
    jmuFWTN.png
    177 KB · Views: 232
Last edited:

Join useThinkScript to post your question to a community of 21,000+ developers and traders.

BenTen, that is a very interesting indicator! These may be simple question, but I see a primary plotting occurs at about 9:35, with a shaded red area following. That stops at 10:29, and a second plotting starts up, widened by the PPs movement from when market opens. I'm just wondering why is the 10:30 point significant? Is it due to algorithms and bots, or after an hour of trades, are major institutional traders restricted from trading. Any hint? Also, by what data are the shaded red/brown areas created, is it volume, or some random noise, or due to sentiment, or short-seller covering? Thanks!
 
Last edited:
I added this to my chart and the indicator didn't show up. Is there a specific time frame you have to use?

I just noticed that it shows up, but only on live charts. It doesn't work on OnDemand unfortunately. Such is the case with the Original ORB Indicator also.
 
Last edited by a moderator:
Hello, if there is a way to automate this to reset hourly?
I'm trying to figure out how to set an hourly range, but from last 2 candles High/Low of prev hour's range.


thanks
 
Last edited:
Hello, if there is a way to automate this to reset hourly?
I'm trying to figure out how to set an hourly range, but from last 2 candles High/Low of prev hour's range.


thanks
That is beyond the essence / purpose of ORB.
You could try posting a request for a new indicator in the Questions Forum
 
Hi @MerryDay (and also the community)!

Happy that this was re-upped cause I remember making a mental note about this particular version of ORB, then forgot about it. Anyway, I've been so used with the original ORB linked above and its different cleaner modifications. And my question (even a request perhaps) is: is there a sub-version of this that has the red-green clouds instead while also retaining the add-ons (directional filter, cum vol etc)? Posting an image below for comparison, the one on the left is what I want to achieve + the add-ons.

Thanks in advanced.

yGCR4bp.png
 
Last edited:
Figured the needed adjustments. Also added cloud on/off switch.
Updated code and sample image below.


flm2enI.png


Code:
# Opening Range Breakout version DDF_R3V5
# Written by KumoBob - aka Bob Campbell
# http://fibonacci-financial.blogspot.com/
## Juy 17, 2022 mod by NeoEon
## Modified bull/bear clouds to green/red; added cloud on/off switch
## Requirements: For use on 1 minute to 5 minute aggregation charts only

# R1V1 2010.01.25
# Wrote DDF
# R2V1 2010.04.01
# Combined Companion DDF with DDF
# R2V3 2010.04.09
# Changed color of tflow and tfhigh to gray
# R2V4 2010.06.01
# Resizing of the cumulative volume cloud
# R2V5 2010.06.08:08:45
# Begin star date
# Added accumulation ratio
# Added alert
# R3V1 2010.06.15:17:00
# Added Fill for the entire day as an option.
# R3V2 2010.06.15:22:00
# Fixed Fill for the entire day as an option.
# R3V3 Removed center plot when not aggregate
# R3V4 2010.06.20:18:00
# Added ChartBubbles
# R3V5 2010.06.21:22:00
# Changed end of highlight

# for more info go to http://www.clayburg.com/jfc_directional_day_filter_indic.htm

#hint:DDF_Accmulation_Companion Study, Best used in a 1 to 5 minute chart period

# Clayburgs Directional Day Filter
# Written by KumoBob Dec 31 2009
#
# Thanks to ThinkScriptor and aPPLE_PI for helping me with the secondsfromtime() function by showing me the code writen by Prospectus in his Opening Range study.


# Directional Day Filter Line - After the first five minutes calculate the average range for this 5-minute bar. Draw a horizontal line at this level.
# Time Line - Draw a vertical line at 60-minute bar (Low to High of the day so far).
# (slower value for faster moving charts like currency and S&P – Faster value for slower moving charts) (45 minutes to 90 minutes)
# Determine the amount of activity above and below the Directional Day Filter Line prior to the Time Line.
# (A rectangle can be drawn with Blue shading above and Red below the Directional Day Filter Line)
# If the majority of the activity is above the Directional Day Filter Line the trend bias for the day will be higher.
# If the majority of the activity is below the Directional Day Filter Line the trend bias for the day will be lower.
# If it's even the day will most likely be flat.
# If the closing bar on the Time Line is within 1/3 the distance from the Directional Day Filter Line then added bias can be anticipated.


# ______________________________________________________________
# Thinkscript is the property of ThinkorSwim and TDAmeritrade
# Sections of this script may have been copied or modified from
# one or more Thinkscript studies in part or in their entirety.
# ______________________________________________________________

input CloudOn  = no;     #hint CloudOn: Clouds Opening Range.
input BubblesOn = Yes;
input ReduceVolumeCloud = 3;
def na = Double.NaN;
############### Directional Day Filter Line ##############


input ShowTodayOnly = Yes;

input FillDay = Yes;
input PCT = 0.65;
input ORBegin = 0930;
input OREnd = 0935;
# ________ Aggregation Alter _________


def aggregation5 = if GetAggregationPeriod() == (AggregationPeriod.MIN * 5) then 1 else 0;
def aggregation1 = if GetAggregationPeriod() == (AggregationPeriod.MIN) then 1 else 0;
def aggregation = if aggregation1 or aggregation5 then 1 else 0;


#input Color_Price ={"Yes" ,default "no" };

# Create logic for OR definition: 1 if between fist 5 minutes
def ORActive = if SecondsTillTime(OREnd) > 0 and SecondsFromTime(ORBegin) >= 0 then 1 else 0;
# Create logic to paint only current day post-open:
def today = if !ShowTodayOnly or GetDay() == GetLastDay() and SecondsFromTime(ORBegin) >= 0 then 1 else 0;
# Track OR High:
rec ORHigh = if ORHigh[1] == 0 or ORActive[1] == 0 and ORActive == 1 then high else if ORActive and high > ORHigh[1] then high else ORHigh[1];
# Track OR Low:
rec ORLow = if ORLow[1] == 0 or ORActive[1] == 0 and ORActive == 1 then low else if ORActive and low < ORLow[1] then low else ORLow[1];
# Calculate OR width:
def ORWidth = ORHigh - ORLow;
# Define all the plots:
def ORHA = if ORActive or today < 1 then na else ORHigh;
def ORLA = if !aggregation or ORActive or today < 1 then na else ORLow;
def O = ORHA - (ORHA - ORLA) / 2;
plot ORL = if !aggregation or O == 0 then na else O;
ORL.SetDefaultColor(Color.YELLOW);
ORL.SetStyle(Curve.LONG_DASH);
ORL.SetLineWeight(3);

################## Time Line #####################

input ORBegin2 = 0930;
# Define time that OR is finished (in hhmm format,
# 10:00 is the default):
input OREnd2 = 1030;
# Show Today only? (Default Yes)
####input ShowTodayOnly={"No", default "Yes"};
####def s=ShowTodayOnly;
# Create logic for OR definition:
def ORActive2 = if SecondsTillTime(OREnd2) > 0 and SecondsFromTime(ORBegin2) >= 0 then 1 else 0;
# Create logic to paint only current day post-open:
#####def today=if s==0 OR getday()==getlastday() AND secondsfromtime(ORBegin2)>=0 then 1 else 0;
# Track OR High:
rec ORHigh2 = if ORHigh2[1] == 0 or ORActive2[1] == 0 and ORActive2 == 1 then high else if ORActive2 and high > ORHigh2[1] then high else ORHigh2[1];
# Track OR Low:
rec ORLow2 = if ORLow2[1] == 0 or ORActive2[1] == 0 and ORActive2 == 1 then low else if ORActive2 and low < ORLow2[1] then low else ORLow2[1];
# Calculate OR width:
def ORWidth2 = ORHigh2 - ORLow2;
# Define all the plots:
plot ORH2 = if !aggregation or ORActive2 or today < 1 then na else ORHigh2;
plot ORL2 = if !aggregation or ORActive2 or today < 1 then na else ORLow2;
# ChartBubbles added Version_6 20100620:17:00

AddChartBubble(BubblesOn && IsNaN(close), ORH2[1], Concat("DDF High ", ORH2[1]), Color.WHITE, yes);
AddChartBubble(BubblesOn && IsNaN(close), O[1], Concat("DDF ", O[1]), Color.WHITE, no);
AddChartBubble(BubblesOn && IsNaN(close), ORL2[1], Concat("DDF Low ", ORL2[1]), Color.WHITE, no);

ORL.HideBubble();
ORL2.HideBubble();
ORH2.HideBubble();


# Formatting:
ORH2.SetDefaultColor(Color.GREEN);
ORH2.SetStyle(Curve.LONG_DASH);
ORH2.SetLineWeight(3);
ORL2.SetDefaultColor(Color.RED);
ORL2.SetStyle(Curve.LONG_DASH);
ORL2.SetLineWeight(3);

################################
def TimeLine = if SecondsTillTime(OREnd2) == 0 then 1 else 0;

def pos = (ORH2 - ORL2) / 10;

plot d1 = If (TimeLine , ORH2, na);
plot d2 = If (TimeLine , ORH2 - ( pos * 2), na);
plot d3 = If (TimeLine , ORH2 - ( pos * 3), na);
plot d4 = If (TimeLine , ORH2 - ( pos * 4), na);
plot d5 = If (TimeLine , ORH2 - ( pos * 5), na);
plot d6 = If (TimeLine , ORH2 - ( pos * 6), na);
plot d7 = If (TimeLine , ORH2 - ( pos * 7), na);
plot d8 = If (TimeLine , ORH2 - ( pos * 8), na);
plot d9 = If (TimeLine , ORH2 - ( pos * 9), na);
plot d10 = If (TimeLine , (ORL2), na);

d1.SetPaintingStrategy(PaintingStrategy.ARROW_DOWN);
d2.SetPaintingStrategy(PaintingStrategy.POINTS);
d3.SetPaintingStrategy(PaintingStrategy.POINTS);
d4.SetPaintingStrategy(PaintingStrategy.POINTS);
d5.SetPaintingStrategy(PaintingStrategy.POINTS);
d6.SetPaintingStrategy(PaintingStrategy.POINTS);
d7.SetPaintingStrategy(PaintingStrategy.POINTS);
d8.SetPaintingStrategy(PaintingStrategy.POINTS);
d9.SetPaintingStrategy(PaintingStrategy.POINTS);
d10.SetPaintingStrategy(PaintingStrategy.ARROW_UP);


def Span = (O - ORL2) / (ORH2 - ORL2);
rec colorState = if Span > PCT then -1
else if Span < 1 - PCT then 1 else 0; # Percent above or below yellow line


d1.AssignValueColor(Color.WHITE);
d2.AssignValueColor(if colorState < 0 then Color.RED else if colorState > 0 then Color.GREEN else Color.YELLOW);

d3.AssignValueColor(if colorState < 0 then Color.RED else if colorState > 0 then Color.GREEN else Color.YELLOW);

d4.AssignValueColor(if colorState < 0 then Color.RED else if colorState > 0 then Color.GREEN else Color.YELLOW);

d5.AssignValueColor(if colorState < 0 then Color.RED else if colorState > 0 then Color.GREEN else Color.YELLOW);

d6.AssignValueColor(if colorState < 0 then Color.RED else if colorState > 0 then Color.GREEN else Color.YELLOW);

d7.AssignValueColor(if colorState < 0 then Color.RED else if colorState > 0 then Color.GREEN else Color.YELLOW);

d8.AssignValueColor(if colorState < 0 then Color.RED else if colorState > 0 then Color.GREEN else Color.YELLOW);

d9.AssignValueColor(if colorState < 0 then Color.RED else if colorState > 0 then Color.GREEN else Color.YELLOW);
## I removed the color logic for d1 and d10 because it could be confused with PPS.
d10.AssignValueColor(Color.WHITE);


input Dot_Size = 1;
d1.SetLineWeight(Dot_Size);
d2.SetLineWeight(Dot_Size);
d3.SetLineWeight(Dot_Size);
d4.SetLineWeight(Dot_Size);
d5.SetLineWeight(Dot_Size);
d6.SetLineWeight(Dot_Size);
d7.SetLineWeight(Dot_Size);
d8.SetLineWeight(Dot_Size);
d9.SetLineWeight(Dot_Size);
d10.SetLineWeight(Dot_Size);

#######################################################################


def TimeLineb = if SecondsTillTime(OREnd) == 0 then 1 else 0;

def posbd = (ORHA - ORLA) / 10;

plot bd1 = If (TimeLineb , ORHA, na);
plot bd2 = If (TimeLineb , ORHA - ( posbd * 2), na);
plot bd3 = If (TimeLineb , ORHA - ( posbd * 3), na);
plot bd4 = If (TimeLineb , ORHA - ( posbd * 4), na);
plot bd5 = If (TimeLineb , ORHA - ( posbd * 5), na);
plot bd6 = If (TimeLineb , ORHA - ( posbd * 6), na);
plot bd7 = If (TimeLineb , ORHA - ( posbd * 7), na);
plot bd8 = If (TimeLineb , ORHA - ( posbd * 8), na);
plot bd9 = If (TimeLineb , ORHA - ( posbd * 9), na);
plot bd10 = If (TimeLineb , (ORL2), na);

bd1.SetPaintingStrategy(PaintingStrategy.POINTS);
bd2.SetPaintingStrategy(PaintingStrategy.POINTS);
bd3.SetPaintingStrategy(PaintingStrategy.POINTS);
bd4.SetPaintingStrategy(PaintingStrategy.POINTS);
bd5.SetPaintingStrategy(PaintingStrategy.POINTS);
bd6.SetPaintingStrategy(PaintingStrategy.POINTS);
bd7.SetPaintingStrategy(PaintingStrategy.POINTS);
bd8.SetPaintingStrategy(PaintingStrategy.POINTS);
bd9.SetPaintingStrategy(PaintingStrategy.POINTS);
bd10.SetPaintingStrategy(PaintingStrategy.POINTS);

bd1.SetDefaultColor(Color.WHITE);
bd2.SetDefaultColor(Color.WHITE);
bd3.SetDefaultColor(Color.WHITE);
bd4.SetDefaultColor(Color.WHITE);
bd5.SetDefaultColor(Color.WHITE);
bd6.SetDefaultColor(Color.WHITE);
bd7.SetDefaultColor(Color.WHITE);
bd8.SetDefaultColor(Color.WHITE);
bd9.SetDefaultColor(Color.WHITE);
bd10.SetDefaultColor(Color.WHITE);


ORL2.AssignValueColor(
if colorState < 0 then Color.RED else
if colorState > 0 then Color.GREEN else
Color.YELLOW);
ORH2.AssignValueColor(
if colorState < 0 then Color.RED else
if colorState > 0 then Color.GREEN else
Color.YELLOW);

## (orig) AddCloud(ORL2, ORH2, CreateColor(010, 010, 010), CreateColor(010, 010, 0100));
addCloud(if CloudOn == yes
         then orL
         else double.nan
       , orL2,color.Red, color.Red);

addCloud(if CloudOn == yes
         then orl
         else double.nan
       , orh2,color.Green, color.Green);


d2.HideBubble();
d3.HideBubble();
d4.HideBubble();
d5.HideBubble();
d6.HideBubble();
d7.HideBubble();
d8.HideBubble();
d9.HideBubble();


bd1.HideBubble();
bd2.HideBubble();
bd3.HideBubble();
bd4.HideBubble();
bd5.HideBubble();
bd6.HideBubble();
bd7.HideBubble();
bd8.HideBubble();
bd9.HideBubble();
bd10.HideBubble();
############### Directional Day Filter Line ##############


################## Time Line ##################


#AddCloud(ORL2, ORH2, color.green, color.green);
################################################

def Width = ORHigh - ORLow;
def H = if ORActive or today < 1 then 0 else ORHigh;
def L = if ORActive or today < 1 then 0 else ORLow;
def center = H - (H - L) / 2;
#############################################

#plot test = if high > center then center +10 else center - 10;;
rec theHigh = if high > center and center > 0 then high - center else 0;
rec sumH = if sumH[1] == 0 and center > 0 then theHigh else if center == 0 then 0 else theHigh + sumH[1];
#plot tfhigh = if (center > 0 , sumH + center, double.nan);
plot tfhigh = If (ORActive2 == 1 and center > 0 , (sumH / ReduceVolumeCloud) + center, Double.NaN);
rec theLow = if low < center and center > 0 then low - center else 0;
rec sumL = if sumL[1] == 0 and center > 0 then theLow else if center == 0 then 0 else theLow + sumL[1];
plot tflow = If (ORActive2 == 1 and center > 0 , (sumL / ReduceVolumeCloud) + center, Double.NaN);
plot zero = If (ORActive2 == 1 and center > 0 , center, Double.NaN);
tflow.SetDefaultColor(Color.GRAY);
tfhigh.SetDefaultColor(Color.GRAY);
AddCloud(tflow , zero, CreateColor(0, 0, 0), CreateColor(190, 90, 90));
AddCloud(tfhigh , zero, CreateColor(090, 65, 20), CreateColor(090, 65, 20));


#rec cum = if timeline then tflow/tfhigh else 2;# cum[1] ;
rec cum = if ORActive && TimeLine then tflow / tfhigh else cum ;


AddLabel(yes, if colorState < 0 then "DDF Bearish" else if colorState > 0 then "DDF Bullish" else "DDF Neutral", if colorState < 0 then Color.RED else if colorState > 0 then Color.GREEN else Color.YELLOW);
#AddChartLabel(yes, if colorState < 0 then "DDF Bearish" else if colorState > 0 then "DDF Bullish" else "DDF Neutral",if colorState < 0 then Color.RED else if colorState > 0 then Color.GREEN else Color.Yellow);
AddLabel(yes, Concat( center, Concat(" ", if colorState < 0 then "DDF" else if colorState > 0 then "DDF" else "DDF ")), (if colorState < 0 then Color.RED else if colorState > 0 then Color.GREEN else Color.YELLOW));
#AddChartLabel(yes, concat( center, concat(" ", if colorState < 0 then "Center - DDF Bearish" else if colorState > 0 then "Center - DDF Bullish" else "Center - DDF Neutral")),(if colorState < 0 then Color.RED else if colorState > 0 then Color.GREEN else Color.Yellow));

AddLabel(yes, Concat( ORH2, Concat(" ", if colorState < 0 then "High Range" else if colorState > 0 then "High Range" else "High Range")), (if colorState < 0 then Color.RED else if colorState > 0 then Color.GREEN else Color.YELLOW));
AddLabel(yes, Concat( ORL2, Concat(" ", if colorState < 0 then "Low Range" else if colorState > 0 then "Low Range" else "Low Range")), (if colorState < 0 then Color.RED else if colorState > 0 then Color.GREEN else Color.YELLOW));

#AddChartLabel(yes, concat( ORH2, concat(" ", if colorState < 0 then "High Range" else if colorState > 0 then "High Range" else "High Range")),(if colorState < 0 then Color.RED else if colorState > 0 then Color.GREEN else Color.Yellow));
#AddChartLabel(yes, concat( ORL2, concat(" ", if colorState < 0 then "Low Range" else if colorState > 0 then "Low Range" else "Low Range")),(if colorState < 0 then Color.RED else if colorState > 0 then Color.GREEN else Color.Yellow));


#AddChartLabel(yes, concat( center, concat(" ", "Center")));

# ____________________________________
# _______________ Alert ______________
# ____________________________________

input SoundType = {Ring, Ding, Chimes, Bell, default NoSound};

def type;
switch (SoundType){
case Ring:
    type = 1;
case Ding:
    type = 2;
case Chimes:
    type = 3;
case Bell:
    type = 4;
case NoSound:
    type = 5;
}

def range = if high() < ORHigh2 and low > ORLow2 then 0 else 1;

Alert(range and type == 1 , "Range Alert", Alert.BAR, Sound.Ring);
Alert(range and type == 2 , "Range Alert", Alert.BAR, Sound.Ding);
Alert(range and type == 3 , "Range Alert", Alert.BAR, Sound.Chimes);
Alert(range and type == 4 , "Range Alert", Alert.BAR, Sound.Bell);
Alert(range and type == 5 , "Range Alert", Alert.BAR, Sound.NoSound);

AddLabel(yes, if type == 5 then "Alert OFF" else if type == 1 then "Alert Ring" else if type == 2 then "Alert Ding" else if type == 3 then "Alert Chimes" else "Alert Bell" , if colorState < 0 then Color.RED else if colorState > 0 then Color.GREEN else Color.YELLOW);
#AddChartLabel(yes, if type == 5 then "Alert OFF" else if type == 1 then "Alert Ring" else if type == 2 then "Alert Ding" else if type == 3 then "Alert Chimes" else "Alert Bell" ,if colorState < 0 then Color.RED else if colorState > 0 then Color.GREEN else Color.Yellow);

# Delete ### AddChartLabel(yes, if type != 5 then "Alter ON" else "Alert OFF",color.white);
# ============================================


# +++++++++++++++++++++++++++++++++++++++++++++++++++


def today2 = if GetDay()[1] == GetLastDay() and SecondsFromTime(1030) >= 0 then 1 else 0;
def PlotThisPeriod = if GetDay() == GetLastDay() &&
SecondsFromTime(1030) >= 0 &&
SecondsTillTime(1430) >= 0
then 1 else 0;
def PeriodIsActive = if SecondsFromTime(0930) >= 0 && SecondsTillTime(1030) >= 0 then 1 else 0;

def FillPeriod = if SecondsFromTime(1030) >= 0 && SecondsTillTime(1430) >= 0 && GetDay() == GetLastDay() then 1 else 0;

rec PeriodHigh = if PeriodIsActive && high > PeriodHigh[1] then high else PeriodHigh[1] ;
rec HighAlert = if PeriodIsActive then PeriodHigh else HighAlert[1] ;

rec PeriodLow = if PeriodIsActive && low < PeriodLow[1] or SecondsFromTime(0930) == 0 then low else PeriodLow[1] ;
rec LowAlert = if PeriodIsActive then PeriodLow else LowAlert[1] ;
rec keepORH2 = if SecondsFromTime(1030) == 0 then ORH2 else keepORH2[1];
rec keepORL2 = if SecondsFromTime(1030) == 0 then ORL2 else keepORL2[1];
plot hg = if !FillPeriod then Double.NaN else keepORH2;
plot lo = if !FillPeriod then Double.NaN else keepORL2;
hg.SetDefaultColor( Color.DARK_GRAY);
lo.SetDefaultColor( Color.DARK_GRAY);
hg.SetLineWeight(1);
lo.SetLineWeight(1);
#plot hg = if !aggregation or !FillPeriod or !FillDay then double.nan else ORH2;
#plot lo = if !aggregation or !PlotThisPeriod or !FillDay then double.nan else If PeriodIsActive then LowAlert else LowAlert[1];
#AddCloud(hg, lo, CreateColor(025, 25, 112) );
AddCloud(hg, lo, Color.DARK_GRAY);

ORL.HideBubble();

## source: https://usethinkscript.com/threads/opening-range-breakout-with-directional-day-filter-for-thinkorswim.130/
 

Similar threads

Not the exact question you're looking for?

Start a new thread and receive assistance from our community.

87k+ Posts
422 Online
Create Post

Similar threads

Similar threads

The Market Trading Game Changer

Join 2,500+ subscribers inside the useThinkScript VIP Membership Club
  • Exclusive indicators
  • Proven strategies & setups
  • Private Discord community
  • ‘Buy The Dip’ signal alerts
  • Exclusive members-only content
  • Add-ons and resources
  • 1 full year of unlimited support

Frequently Asked Questions

What is useThinkScript?

useThinkScript is the #1 community of stock market investors using indicators and other tools to power their trading strategies. Traders of all skill levels use our forums to learn about scripting and indicators, help each other, and discover new ways to gain an edge in the markets.

How do I get started?

We get it. Our forum can be intimidating, if not overwhelming. With thousands of topics, tens of thousands of posts, our community has created an incredibly deep knowledge base for stock traders. No one can ever exhaust every resource provided on our site.

If you are new, or just looking for guidance, here are some helpful links to get you started.

What are the benefits of VIP Membership?
VIP members get exclusive access to these proven and tested premium indicators: Buy the Dip, Advanced Market Moves 2.0, Take Profit, and Volatility Trading Range. In addition, VIP members get access to over 50 VIP-only custom indicators, add-ons, and strategies, private VIP-only forums, private Discord channel to discuss trades and strategies in real-time, customer support, trade alerts, and much more. Learn all about VIP membership here.
How can I access the premium indicators?
To access the premium indicators, which are plug and play ready, sign up for VIP membership here.
Back
Top