Hello y'all!
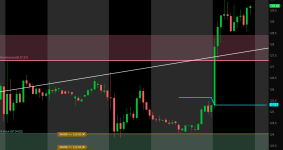
I'm trying to get a script going that plots a horizontal line for the opening print, meaning the open price of the 9:30 am EST candle. I have this code going but it's ploting the line before the candle. Any idea how to have it just at that candle and expanding to the right?
Thanks in advance!
I'm trying to get a script going that plots a horizontal line for the opening print, meaning the open price of the 9:30 am EST candle. I have this code going but it's ploting the line before the candle. Any idea how to have it just at that candle and expanding to the right?
Thanks in advance!
Code:
input showOnlyLastPeriod = yes;
def label = yes;

def isOpen = GetTime() crosses above RegularTradingStart(GetYYYYMMDD());
# def isClosed = GetTime() crosses RegularTradingEnd(GetYYYYMMDD());

# def prevClose = close[1];
def firstBarOpen = if isOpen and !isOpen[1] then open else firstBarOpen[1];
# def firstBarClose = if isClosed and !isClosed[1] then open else firstBarClose[1];

plot OpeningPrice;
OpeningPrice.SetPaintingStrategy(PaintingStrategy.LINE);
OpeningPrice.SetDefaultColor(Color.CYAN);
OpeningPrice.SetLineWeight(2);

def shouldHidePlot = showOnlyLastPeriod and !IsNaN(close(period = AggregationPeriod.DAY)[-1]);

if shouldHidePlot {
    OpeningPrice = Double.NaN;
} else {
    OpeningPrice = firstBarOpen;
}

AddLabel(label, "OP: " + AsDollars(OpeningPrice), Color.CYAN);