candle value at x hour

shakib3585

Active member
VIP
Hello All,

Identify the High, Low, and Close values of a one-hour candle formed between 16:00 and 17:00 (EST)

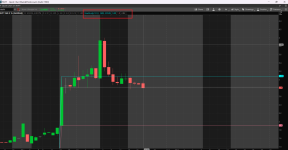
I am looking for a ThinkScript code that can identify the high, low, and close values of a one-hour candle formed between 16:00 and 17:00 (EST) and plot them as horizontal lines. I also intend to utilize this script for scanning purposes with a one-hour aggregation period, enabling it to scan stocks where the closing price has crossed below the low of the 16:00–17:00 candle. Please help.

Thank you very much

Bumping up the post again for attention
 
Last edited by a moderator:
Hello All,

Identify the High, Low, and Close values of a one-hour candle formed between 16:00 and 17:00 (EST)

I am looking for a ThinkScript code that can identify the high, low, and close values of a one-hour candle formed between 16:00 and 17:00 (EST) and plot them as horizontal lines. I also intend to utilize this script for scanning purposes with a one-hour aggregation period, enabling it to scan stocks where the closing price has crossed below the low of the 16:00–17:00 candle. Please help.

Thank you very much

Bumping up the post again for attention

This is code for the chart. For the scan code, change the plots for the lines to defs and remove all the paintingstrategies code.
Screenshot 2024-03-22 085335.png

#HLC_Lookback_Periods_Time
input lookback = 1;
input time = 1700;
input agg = AggregationPeriod.HOUR;

def cond = SecondsFromTime(time)[1] < 0 and SecondsFromTime(time) >= 0 or SecondsFromTime(time) == 0;

def ymd = GetYYYYMMDD();
def count = if !IsNaN(close) and ymd != ymd[1] then count[1] + 1 else count[1];
def cond1 = HighestAll(count) - count ;

def H = if cond1 == lookback and cond then high(period = agg) else H[1];
def L = if cond1 == lookback and cond then low(period = agg) else L[1];
def C = if cond1 == lookback and cond then close(period = agg) else C[1];

plot Hi = H;
plot Lo = L;
plot Cl = C;

Hi.SetPaintingStrategy(PaintingStrategy.HORIZONTAL);
Lo.SetPaintingStrategy(PaintingStrategy.HORIZONTAL);
Cl.SetPaintingStrategy(PaintingStrategy.HORIZONTAL);

input troubleshoot = no;
AddChartBubble(troubleshoot, low, cond + "\n" + cond1 + "\n" + GetDay() + "\n" + cond + "\n" + Hi, Color.GRAY, no);

#
 
Last edited:

Join useThinkScript to post your question to a community of 21,000+ developers and traders.

This is code for the chart. For the scan code, change the plots for the lines to defs and remove all the paintingstrategies code.
Thank you @SleepyZ. I have one request, please, for this code. Can you modify the code by having a provision for getback. What I request is for any given getback (1 day back, 2 days back etc.) I would like to see the high, low and close plots for the same 1 hour bar.
Thank you
 
Thank you @SleepyZ. I have one request, please, for this code. Can you modify the code by having a provision for getback. What I request is for any given getback (1 day back, 2 days back etc.) I would like to see the high, low and close plots for the same 1 hour bar.
Thank you

Try this

#HLC_Lookback_Periods_Time
input lookback = 1;
input time = 1700;
input agg = AggregationPeriod.HOUR;

def cond = SecondsFromTime(time)[1] < 0 and SecondsFromTime(time) >= 0 or SecondsFromTime(time) == 0;

def ymd = GetYYYYMMDD();
def count = if !IsNaN(close) and ymd != ymd[1] then count[1] + 1 else count[1];
def cond1 = HighestAll(count) - count ;

def H = if cond1 == lookback and cond then high(period = agg) else H[1];
def L = if cond1 == lookback and cond then low(period = agg) else L[1];
def C = if cond1 == lookback and cond then close(period = agg) else C[1];

plot Hi = H;
plot Lo = L;
plot Cl = C;

Hi.SetPaintingStrategy(PaintingStrategy.HORIZONTAL);
Lo.SetPaintingStrategy(PaintingStrategy.HORIZONTAL);
Cl.SetPaintingStrategy(PaintingStrategy.HORIZONTAL);

input troubleshoot = no;
AddChartBubble(troubleshoot, low, cond + "\n" + cond1 + "\n" + GetDay() + "\n" + cond + "\n" + Hi, Color.GRAY, no);

#

plot scan = close crosses below Lo;
scan.SetPaintingStrategy(PaintingStrategy.BOOLEAN_ARROW_DOWN);

#
 
Last edited:
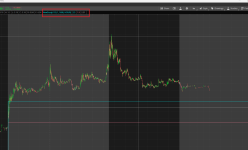
thank you @SleepyZ , I plotted your study on a 1-hour aggregation and on a 1-minute aggregation for the ticker NVFY. I see the values in 1 hour aggregation are correct but the same plot in 1 minute aggregation is showing different numbers. Can you please help to fix the error?

Thank you very much
 

Attachments

  • 1 hour.png
    1 hour.png
    229.5 KB · Views: 54
  • 1 minute.png
    1 minute.png
    257.7 KB · Views: 54
thank you @SleepyZ , I plotted your study on a 1-hour aggregation and on a 1-minute aggregation for the ticker NVFY. I see the values in 1 hour aggregation are correct but the same plot in 1 minute aggregation is showing different numbers. Can you please help to fix the error?

Thank you very much
Fixed it
Code:
input lookback = 1;
input time = 1700;
input agg  = AggregationPeriod.HOUR;
def cond   = SecondsFromTime(time)[1] < 0 and SecondsFromTime(time) >= 0;
def H = if getday()== getlastday() - lookback and cond then high(period=agg) else H[1];
def L = if getday()== getlastday() - lookback and cond then low(period=agg) else L[1];
def C = if getday()== getlastday() - lookback and cond then close(period=agg) else C[1];

plot Hi = H;
plot Lo = L;
plot Cl = C;
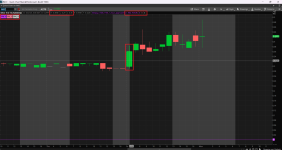
Hello @SleepyZ , I had a strange issue with this code today, pre-market. I used a 1-day lookback with the time given as 0900. the ticker was IMCC. I saw that even though there were values for the high, low, and close, the code was showing "0" values. Can you please help to resolve it.

Thank you very much
 

Attachments

  • IMCC.png
    IMCC.png
    291.3 KB · Views: 34
Last edited:
Hello @SleepyZ , I had a strange issue with this code today, pre-market. I used a 1-day lookback with the time given as 0900. the ticker was IMCC. I saw that even though there were values for the high, low, and close, the code was showing "0" values. Can you please help to resolve it.

Thank you very much

Fixed.
Regrettably, time and timeframes are not straight forward with TOS.
This needed more complex code than just using the getday() or getyyyymmdd() by themselves.
The optional troubleshooter is what I often use to detact problems.

Screenshot 2024-03-25 025449.png
Code:
#HLC_Lookback_Periods_Time
input lookback = 1;
input time     = 1700;
input agg      = AggregationPeriod.HOUR;

def cond   = SecondsFromTime(time)[1] < 0 and SecondsFromTime(time) >= 0 or SecondsFromTime(time) == 0;

def ymd    = GetYYYYMMDD();
def count  = if !IsNaN(close) and ymd != ymd[1] then count[1] + 1 else count[1];
def cond1  = HighestAll(count) - count ;

def H = if cond1 == lookback and cond then high(period = agg) else H[1];
def L = if cond1 == lookback and cond then low(period = agg) else L[1];
def C = if cond1 == lookback and cond then close(period = agg) else C[1];

plot Hi = H;
plot Lo = L;
plot Cl = C;

Hi.SetPaintingStrategy(PaintingStrategy.HORIZONTAL);
Lo.SetPaintingStrategy(PaintingStrategy.HORIZONTAL);
Cl.SetPaintingStrategy(PaintingStrategy.HORIZONTAL);

input troubleshoot = no;
AddChartBubble(troubleshoot, low, cond + "\n" + cond1 + "\n" + GetDay() + "\n" + cond + "\n" + Hi, Color.GRAY, no);

#
 
Last edited:
Fixed.
Regrettably, time and timeframes are not straight forward with TOS.
This needed more complex code than just using the getday() or getyyyymmdd() by themselves.
The optional troubleshooter is what I often use to detact problems.
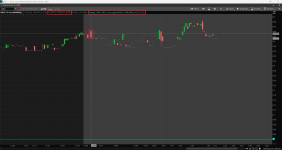
Thank you so much, @SleepyZ . For a check, I used the 1 minute aggregation with a 1 day lookback and using the time as 1606. Unfortunately, it is showing the same error at 1 minute aggregation
 

Attachments

  • IMCC.png
    IMCC.png
    257.3 KB · Views: 33
Thank you so much, @SleepyZ . For a check, I used the 1 minute aggregation with a 1 day lookback and using the time as 1606. Unfortunately, it is showing the same error at 1 minute aggregation
Sorry, too early here. I corrected this line that was missing an inportant exclamation mark and posted it in the above code.
def count = if !IsNaN(close) and ymd != ymd[1] then count[1] + 1 else count[1];
Screenshot 2024-03-25 033530.png
 
Thank you to the extreme, @SleepyZ !
One request, please, @SleepyZ . Alongside the option of the lookback period, can you help to modify the code so that I can lookback based on a given previous date. For example, if I want to go to a date 5 days ago, I will just input the date 5 days back and it will go there. I would like to have the final option as I will have a choice to lookback either with a given earlier date, or with a lookback period.

Thank you very much

This now has a mode input for Period or Date.

Screenshot 2024-04-08 073007.png
Code:
#HLC_Lookback_Periods_Time_or_Date

input mode     = {default Period, Date};
input lookback = 1;
input dateback = 20240401;
input time     = 1700;
input agg      = AggregationPeriod.HOUR;

def cond   = SecondsFromTime(time)[1] < 0 and SecondsFromTime(time) >= 0 or SecondsFromTime(time) == 0;

def ymd    = GetYYYYMMDD();
def count  = if !IsNaN(close) and ymd != ymd[1] then count[1] + 1 else count[1];
def cond1  = HighestAll(count) - count ;

def H = if
        if mode == mode.Date
        then GetYYYYMMDD() == dateback and cond
        else cond1 == lookback and cond
        then high(period = agg)
        else H[1];
def L = if
        if mode == mode.Date
        then GetYYYYMMDD() == dateback and cond
        else cond1 == lookback and cond
        then low(period = agg)
        else L[1];
def C = if
        if mode == mode.Date
        then GetYYYYMMDD() == dateback and cond
        else cond1 == lookback and cond
        then close(period = agg)
        else C[1];

plot Hi = H;
plot Lo = L;
plot Cl = C;

Hi.SetPaintingStrategy(PaintingStrategy.HORIZONTAL);
Lo.SetPaintingStrategy(PaintingStrategy.HORIZONTAL);
Cl.SetPaintingStrategy(PaintingStrategy.HORIZONTAL);

input troubleshoot = no;
AddChartBubble(troubleshoot, low, cond + "\n" + cond1 + "\n" + GetDay() + "\n" + cond + "\n" + Hi, Color.GRAY, no);

#
 
Thanks a ton @SleepyZ ! One request please, Could you kindly add a label indicating the Relative volume, calculated based on the standard deviation and the number of lengths used, at that specified lookback or previous date?

Thank you very much

RelVol@Stdevlevel @Agg Label added.
Since almost all levels @1700 were zero, the image shows @0900

Screenshot 2024-04-09 065921.png
Code:
#HLC_Lookback_Periods_Time_or_Date

input mode     = {default Period, Date};
input lookback = 1;
input dateback = 20240401;
input time     = 1700;
input agg      = AggregationPeriod.HOUR;

def cond   = SecondsFromTime(time)[1] < 0 and SecondsFromTime(time) >= 0 or SecondsFromTime(time) == 0;

def ymd    = GetYYYYMMDD();
def count  = if !IsNaN(close) and ymd != ymd[1] then count[1] + 1 else count[1];
def cond1  = HighestAll(count) - count ;

def H = if
        if mode == mode.Date
        then GetYYYYMMDD() == dateback and cond
        else cond1 == lookback and cond
        then high(period = agg)
        else H[1];
def L = if
        if mode == mode.Date
        then GetYYYYMMDD() == dateback and cond
        else cond1 == lookback and cond
        then low(period = agg)
        else L[1];
def C = if
        if mode == mode.Date
        then GetYYYYMMDD() == dateback and cond
        else cond1 == lookback and cond
        then close(period = agg)
        else C[1];

plot Hi = H;
plot Lo = L;
plot Cl = C;

Hi.SetPaintingStrategy(PaintingStrategy.HORIZONTAL);
Lo.SetPaintingStrategy(PaintingStrategy.HORIZONTAL);
Cl.SetPaintingStrategy(PaintingStrategy.HORIZONTAL);

input troubleshoot = no;
AddChartBubble(troubleshoot, low, cond + "\n" + cond1 + "\n" + GetDay() + "\n" + cond + "\n" + Hi, Color.GRAY, no);

########### RelativeVolume @Stdev Level Label

input showlabel = yes;
input length = 60;
input numDev = 2.0;
input allowNegativeValues = no;

def rawRelVol = (volume(period = agg) - Average(volume(period = agg), length)) / StDev(volume(period = agg), length);
plot RelVol = if allowNegativeValues then rawRelVol else Max(0, rawRelVol);
plot StDevLevel = numDev;

def r = if
        if mode == mode.Date
        then GetYYYYMMDD() == dateback and cond
        else cond1 == lookback and cond
        then RelVol
        else r[1];

def xdate = if mode == mode.Date then dateback else if mode == mode.Period and cond1 then GetYYYYMMDD() else xdate[1];
AddLabel(showlabel, AsPrice(xdate) + " @" + AsPrice(time) + "  RVOL: " + r, Color.YELLOW);
#
 
Hello @SleepyZ , Could we check if stocks had any 1-hour candle exhibiting a relative volume of 2.1 (length = 20, standard deviation = 2.0). If so, I'd request to find stocks where the closing price of the current hour is higher than the high of that candle.

Thank you very much

This finds when the current bar's high is higher than the previous bar's high where your relative volume condition occurred.

Code:
input agg = AggregationPeriod.HOUR;

input showlabel = yes;
input length = 20;
input numDev = 2.0;
input allowNegativeValues = no;

def bn = BarNumber();
def na = Double.NaN;

def rawRelVol  = (volume(period = agg) - Average(volume(period = agg), length)) / StDev(volume(period = agg), length);
def RelVol     = if allowNegativeValues then rawRelVol else Max(0, rawRelVol);
def StDevLevel = numDev;
def condbar    = if RelVol crosses above 2.1 then bn else na;
plot scan      = bn - 1 == HighestAll(condbar) and high(period = agg) > high(period = agg)[1];

#
Thank you @SleepyZ . Can I directly use it in the scanner?
 

Not the exact question you're looking for?

Start a new thread and receive assistance from our community.

87k+ Posts
480 Online
Create Post

The Market Trading Game Changer

Join 2,500+ subscribers inside the useThinkScript VIP Membership Club
  • Exclusive indicators
  • Proven strategies & setups
  • Private Discord community
  • ‘Buy The Dip’ signal alerts
  • Exclusive members-only content
  • Add-ons and resources
  • 1 full year of unlimited support

Frequently Asked Questions

What is useThinkScript?

useThinkScript is the #1 community of stock market investors using indicators and other tools to power their trading strategies. Traders of all skill levels use our forums to learn about scripting and indicators, help each other, and discover new ways to gain an edge in the markets.

How do I get started?

We get it. Our forum can be intimidating, if not overwhelming. With thousands of topics, tens of thousands of posts, our community has created an incredibly deep knowledge base for stock traders. No one can ever exhaust every resource provided on our site.

If you are new, or just looking for guidance, here are some helpful links to get you started.

What are the benefits of VIP Membership?
VIP members get exclusive access to these proven and tested premium indicators: Buy the Dip, Advanced Market Moves 2.0, Take Profit, and Volatility Trading Range. In addition, VIP members get access to over 50 VIP-only custom indicators, add-ons, and strategies, private VIP-only forums, private Discord channel to discuss trades and strategies in real-time, customer support, trade alerts, and much more. Learn all about VIP membership here.
How can I access the premium indicators?
To access the premium indicators, which are plug and play ready, sign up for VIP membership here.
Back
Top