shakib3585
Active member
Hello All,
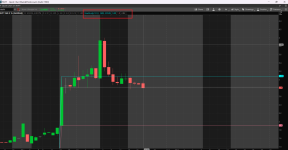
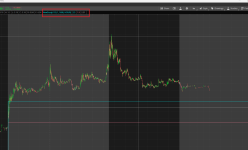
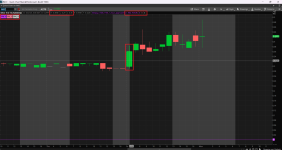
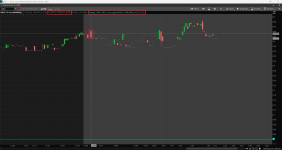
Identify the High, Low, and Close values of a one-hour candle formed between 16:00 and 17:00 (EST)
I am looking for a ThinkScript code that can identify the high, low, and close values of a one-hour candle formed between 16:00 and 17:00 (EST) and plot them as horizontal lines. I also intend to utilize this script for scanning purposes with a one-hour aggregation period, enabling it to scan stocks where the closing price has crossed below the low of the 16:00–17:00 candle. Please help.
Thank you very much
Bumping up the post again for attention
Last edited by a moderator: