
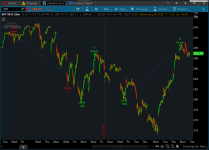
This strategy was based on the Regression Channel indicator for ThinkorSwim. According to the original page, the strategy is based on offset regression bands and works well with indices and diverse ETFs.
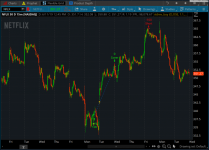
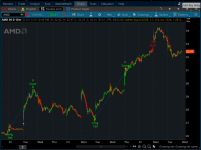
I tested it on several large cap stocks and the signals worked out well most of the time too.
Some examples include AMD, MCD, and SPY. There is a built-in watchlist in ThinkorSwim called Indices and All ETFs. You can quickly pull them up and test out the tickers on there.


Keep in mind that hindsight is always 20/20. I haven't been able to find a single misleading signal from this indicator so I'm suspecting that there is some sort of repainting going on. I'll continue to watch it. Let me know if you guys find something.
I tested it on several large cap stocks and the signals worked out well most of the time too.
Some examples include AMD, MCD, and SPY. There is a built-in watchlist in ThinkorSwim called Indices and All ETFs. You can quickly pull them up and test out the tickers on there.
thinkScript Code for Long
Rich (BB code):
# stdrev buy
# Strategy added by BenTen
# Original https://github.com/dougives/stdrev/blob/master/stdrev.thinkscript

def OPEN_ACTUAL_TIME = 0930;
def CLOSE_ACTUAL_TIME = 1600;
def is_trading_hours = If((SecondsFromTime(OPEN_ACTUAL_TIME) >= 0 && SecondsTillTime(CLOSE_ACTUAL_TIME) > 0), 1, 0);

def stoploss = close < close[-10] * 0.95;

def rsi = RSI("average type" = "EXPONENTIAL");

input price = close;
input deviations = 1.1;
input short_gap = 0.3;
input full_range = no;
input length = 1024;
input spread = 0.0001;
input overshoot = 0.2;
input tradesize = 1;
input only_when_open = no;

def regression;
def std_deviation;
if (full_range) {
    regression = InertiaAll(price);
    std_deviation = StDevAll(price);
} else {
    regression = InertiaAll(price, length);
    std_deviation = StDevAll(price, length);
}

def upper = regression + deviations * std_deviation;
def breaker = regression + overshoot * std_deviation;
def middle = regression;
def lower = regression - deviations * std_deviation;

def upper_s = regression + (deviations + short_gap) * std_deviation;
def breaker_s = regression - overshoot * std_deviation;
def middle_s = regression;
def lower_s = regression - (deviations + short_gap) * std_deviation;

def buy = price crosses above lower - spread;
def sell2c = price crosses above breaker;

plot buy1 = buy;
buy1.SetPaintingStrategy(PaintingStrategy.BOOLEAN_ARROW_UP);
buy1.SetDefaultColor(GetColor(8));
buy1.SetLineWeight(2);

AddOrder(OrderType.BUY_TO_OPEN, condition = buy, price = open,100, tickcolor = Color.GREEN, arrowcolor = Color.GREEN, name = "Long");

AddOrder(OrderType.SELL_TO_CLOSE, condition = sell2c, price = close,100, tickcolor = Color.GREEN, arrowcolor = Color.GREEN, name = "Cover");
thinkScript Code for Short
Rich (BB code):
# stdrev sell
# Strategy added by BenTen
# Original https://github.com/dougives/stdrev/blob/master/stdrev.thinkscript

def OPEN_ACTUAL_TIME = 0930;
def CLOSE_ACTUAL_TIME = 1600;
def is_trading_hours = If((SecondsFromTime(OPEN_ACTUAL_TIME) >= 0 && SecondsTillTime(CLOSE_ACTUAL_TIME) > 0), 1, 0);

def stoploss = close < close[-10] * 0.95;

def rsi = RSI("average type" = "EXPONENTIAL");

input price = close;
input deviations = 1.1;
input short_gap = 0.3;
input full_range = no;
input length = 1024;
input spread = 0.0001;
input overshoot = 0.2;
input tradesize = 1;
input only_when_open = no;

def regression;
def std_deviation;
if (full_range) {
    regression = InertiaAll(price);
    std_deviation = StDevAll(price);
} else {
    regression = InertiaAll(price, length);
    std_deviation = StDevAll(price, length);
}

def upper = regression + deviations * std_deviation;
def breaker = regression + overshoot * std_deviation;
def middle = regression;
def lower = regression - deviations * std_deviation;

def upper_s = regression + (deviations + short_gap) * std_deviation;
def breaker_s = regression - overshoot * std_deviation;
def middle_s = regression;
def lower_s = regression - (deviations + short_gap) * std_deviation;

def short = price crosses below upper_s + spread;
def buy2c = price crosses below breaker_s;

AddOrder(OrderType.SELL_TO_OPEN, condition = short, price = open,100, tickcolor = Color.RED, arrowcolor = Color.RED, name = "Short");

AddOrder(OrderType.BUY_TO_CLOSE, condition = buy2c, price = close,100, tickcolor = Color.RED, arrowcolor = Color.RED, name = "Cover");
Keep in mind that hindsight is always 20/20. I haven't been able to find a single misleading signal from this indicator so I'm suspecting that there is some sort of repainting going on. I'll continue to watch it. Let me know if you guys find something.
Attachments
Last edited: