$NYSI - McClellan Summation Index for ThinkorSwim

markos

Well-known member
VIP
Here's the McClellan Summation Index indicator for ThinkorSwim.

Code:
declare lower;

input exchange = {default NYSE, NASDAQ, AMEX};
input fastLength = 19;
input slowLength = 39;
input ratioAdjusted = No;
input isCumulative = Yes;

def advances;
def declines;
switch (exchange) {
case NYSE:
    advances = close("$ADVN");
    declines = close("$DECN");
case NASDAQ:
    advances = close("$ADVN/Q");
    declines = close("$DECN/Q");
case AMEX:
    advances = close("$ADVA");
    declines = close("$DECA");
}
def breadth;
def neutral_level;
def over_bought;
def over_sold;

if (ratioAdjusted) {
    breadth = 1000 * (advances - declines) / (advances +
 declines);
    neutral_level = 0;
    over_bought = 500;
    over_sold = -500;
} else {
    breadth = advances - declines;
    neutral_level = 1000;
    over_bought = Double.NaN;
    over_sold = Double.NaN;
}

def emaFastCorr = ExpAverage(CompoundValue(1, if !IsNaN(breadth) then breadth else emaFastCorr[1], 0), fastLength);
def emaSlowCorr = ExpAverage(CompoundValue(1, if !IsNaN(breadth) then breadth else emaSlowCorr[1], 0), slowLength);
def mcClellanOsc = if !IsNaN(close) then emaFastCorr - emaSlowCorr else Double.NaN;
def mcClellanSummationIndex = mcClellanSummationIndex[1] + if !IsNaN(breadth) then mcClellanOsc else 0;

plot SummationIndex;
if IsNaN(close) {
    SummationIndex = Double.NaN;
} else if (isCumulative) {
    SummationIndex = neutral_level + mcClellanSummationIndex;
} else {
    SummationIndex = neutral_level + mcClellanOsc - (10 * emaFastCorr + 20 * emaSlowCorr);
}
plot OverBought = over_bought;
plot OverSold = over_sold;
plot NeutralLevel = neutral_level;

SummationIndex.SetDefaultColor(GetColor(1));
OverBought.SetDefaultColor(GetColor(5));
OverSold.SetDefaultColor(GetColor(5));
NeutralLevel.SetDefaultColor(GetColor(7));

Bonus: ThinkorSwim also provides a list of different index indicators. You can find their ticker symbol below.

There is NO % Above or % Below ANY average. I have asked a programmer at TDA directly. For whatever reason, the answer is that they aren't easily able to do it.

NYSE listed: listed on NYSE trades only on NYSE
  • $ADD NYSE Advancing Issues - Declining Issues Difference
  • $ADVN NYSE Advanced issues
  • $DECN NYSE Declined issues
  • $DVOL NYSE Declined volume
  • $TICK NYSE TICK
  • $TRIN NYSE TRIN
  • $TVOL NYSE Total volume
  • $UNCN NYSE Unchanged issues
  • $UVOL NYSE Advanced volume
  • $VOLD NYSE Up Volume - Down Volume Difference
NYSE listed: Listed on NYSE traded anywhere
  • $ADDC NYSE Composite Advancing Issues - Declining Issues Difference
  • $ADVNC NYSE Composite Advanced issues
  • $DECNC NYSE Composite Declined issues
  • $DVOLC NYSE Composite Declined volume
  • $TICKC NYSE Composite TICK
  • $TRINC NYSE Composite TRIN
  • $TVOLC NYSE Composite Total volume
  • $UNCNC NYSE Composite Unchanged issues
  • $UVOLC NYSE Composite Advanced volume
  • $VOLDC NYSE Composite Up Volume - Down Volume Difference
AMEX listed: Primary Markets only
  • $ADAD NYSE MKT (AMEX) Advancing Issues - Declining Issues Difference
  • $ADVA NYSE MKT (AMEX) Advanced issues
  • $DECA NYSE MKT (AMEX) Declined issues
  • $DVOA NYSE MKT (AMEX) Declined volume
  • $TICKA NYSE MKT (AMEX) TICK
  • $TRINA NYSE MKT (AMEX) TRIN
  • $TVOA NYSE MKT (AMEX) Total volume
  • $UNCA NYSE MKT (AMEX) Unchanged issues
  • $UVOA NYSE MKT (AMEX) Advanced volume
  • $VOLAD NYSE MKT (AMEX) Up Volume - Down Volume Difference
AMEX listed: All Markets
  • $ADADC NYSE MKT (AMEX) Composite Advancing Issues - Declining Issues Difference
  • $ADVAC NYSE MKT (AMEX) Composite Advanced issues
  • $DECAC NYSE MKT (AMEX) Composite Declined issues
  • $DVOAC NYSE MKT (AMEX) Composite Declined volume
  • $TICKAC NYSE MKT (AMEX) Composite TICK
  • $TRINAC NYSE MKT (AMEX) Composite TRIN
  • $TVOAC NYSE MKT (AMEX) Composite Total volume
  • $UNCAC NYSE MKT (AMEX) Composite Unchanged issues
  • $UVOAC NYSE MKT (AMEX) Composite Advanced volume
  • $VOLADC NYSE MKT (AMEX) Composite Up Volume - Down Volume Difference
NYSE ARCA listed: Primary Markets only
  • $ADARD NYSE ARCA Advancing Issues - Declining Issues Difference
  • $ADVAR NYSE ARCA Advanced issues
  • $DECAR NYSE ARCA Declined issues
  • $DVOAR NYSE ARCA Declined volume
  • $TICKAR NYSE ARCA TICK
  • $TRINAR NYSE ARCA TRIN
  • $TVOAR NYSE ARCA Total volume
  • $UNCAR NYSE ARCA Unchanged issues
  • $UVOAR NYSE ARCA Advanced volume
  • $VOLARD NYSE ARCA Up Volume - Down Volume Difference
NYSE ARCA listed: All Markets
  • $ADARDC NYSE ARCA Composite Advancing Issues - Declining Issues Difference
  • $ADVARC NYSE ARCA Composite Advanced issues
  • $DECARC NYSE ARCA Composite Declined issues
  • $DVOARC NYSE ARCA Composite Declined volume
  • $TICKARC NYSE ARCA Composite TICK
  • $TRINARC NYSE ARCA Composite TRIN
  • $TVOARC NYSE ARCA Composite Total volume
  • $UNCARC NYSE ARCA Composite Unchanged issues
  • $UVOARC NYSE ARCA Composite Advanced volume
  • $VOLARDC NYSE ARCA Composite Up Volume - Down Volume Difference
NASDAQ listed: Primary Markets only
  • $ADQD NASDAQ Advancing Issues - Declining Issues Difference
  • $ADVN/Q NASDAQ Advanced issues
  • $DECN/Q NASDAQ Declined issues
  • $DVOL/Q NASDAQ Declined volume
  • $TICK/Q NASDAQ TICK
  • $TRIN/Q NASDAQ TRIN
  • $TVOL/Q NASDAQ Total volume
  • $UNCN/Q NASDAQ Unchanged issues
  • $UVOL/Q NASDAQ Advanced volume
  • $VOLQD NASDAQ Up Volume - Down Volume Difference
NASDAQ listed: All Markets
  • $ADQDC NASDAQ Composite Advancing Issues - Declining Issues Difference
  • $ADVNC/Q NASDAQ Composite Advanced issues
  • $DECNC/Q NASDAQ Composite Declined issues
  • $DVOLC/Q NASDAQ Composite Declined volume
  • $TICKC/Q NASDAQ Composite TICK
  • $TRINC/Q NASDAQ Composite TRIN
  • $TVOLC/Q NASDAQ Composite Total volume
  • $UNCNC/Q NASDAQ Composite Unchanged issues
  • $UVOLC/Q NASDAQ Composite Advanced volume
  • $VOLQDC NASDAQ Composite Up Volume - Down Volume Difference
DJIA components: Primary Markets only
  • $ADID DJIA Advancing Issues - Declining Issues Difference
  • $ADVI DJIA Advanced issues
  • $DECLI DJIA Declined issues
  • $DVOLI DJIA Declined volume
  • $TIKI DJIA TICK
  • $TRINI DJIA TRIN
  • $TVOLI DJIA Total volume
  • $UNCHI DJIA Unchanged issues
  • $UVOLI DJIA Advanced volume
  • $VOLID DJIA Up Volume - Down Volume Difference
DJIA components: All Markets
  • $ADIDC DJIA Composite Advancing Issues - Declining Issues Difference
  • $ADVIC DJIA Composite Advanced issues
  • $DECLIC DJIA Composite Declined issues
  • $DVOLIC DJIA Composite Declined volume
  • $TIKIC DJIA Composite TICK
  • $TRINIC DJIA Composite TRIN
  • $TVOLIC DJIA Composite Total volume
  • $UNCHIC DJIA Composite Unchanged issues
  • $UVOLIC DJIA Composite Advanced volume
  • $VOLIDC DJIA Composite Up Volume - Down Volume Difference
S&P 500 components: Primary Markets only
  • $ADSPD SNP 500 Advancing Issues - Declining Issues Difference
  • $ADVSP SNP 500 Advanced issues
  • $DECLSP SNP 500 Declined issues
  • $DVOLSP SNP 500 Declined volume
  • $TIKSP SNP 500 TICK
  • $TRINSP SNP 500 TRIN
  • $TVOLSP SNP 500 Total volume
  • $UNCHSP SNP 500 Unchanged issues
  • $UVOLSP SNP 500 Advanced volume
  • $VOLSPD SNP 500 Up Volume - Down Volume Difference
S&P 500 components: All Markets
  • $ADSPDC SNP 500 Composite Advancing Issues - Declining Issues Difference
  • $ADVSPC SNP 500 Composite Advanced issues
  • $DECLSPC SNP 500 Composite Declined issues
  • $DVOLSPC SNP 500 Composite Declined volume
  • $TIKSPC SNP 500 Composite TICK
  • $TRINSPC SNP 500 Composite TRIN
  • $TVOLSPC SNP 500 Composite Total volume
  • $UNCHSPC SNP 500 Composite Unchanged issues
  • $UVOLSPC SNP 500 Composite Advanced volume
  • $VOLSPDC SNP 500 Composite Up Volume - Down Volume Difference
NASDAQ 100 components: Primary Markets only
  • $ADNDD NASDAQ 100 Advancing Issues - Declining Issues Difference
  • $ADVND NASDAQ 100 Advanced issues
  • $DECLND NASDAQ 100 Declined issues
  • $DVOLND NASDAQ 100 Declined volume
  • $TIKND NASDAQ 100 TICK
  • $TRINND NASDAQ 100 TRIN
  • $TVOLND NASDAQ 100 Total volume
  • $UNCHND NASDAQ 100 Unchanged issues
  • $UVOLND NASDAQ 100 Advanced volume
  • $VOLNDD NASDAQ 100 Up Volume - Down Volume Difference
NASDAQ 100 components: All Markets
  • $ADNDDC NASDAQ 100 Composite Advancing Issues - Declining Issues Difference
  • $ADVNDC NASDAQ 100 Composite Advanced issues
  • $DECLNDC NASDAQ 100 Composite Declined issues
  • $DVOLNDC NASDAQ 100 Composite Declined volume
  • $TIKNDC NASDAQ 100 Composite TICK
  • $TRINNDC NASDAQ 100 Composite TRIN
  • $TVOLNDC NASDAQ 100 Composite Total volume
  • $UNCHNDC NASDAQ 100 Composite Unchanged issues
  • $UVOLNDC NASDAQ 100 Composite Advanced volume
  • $VOLNDDC NASDAQ 100 Composite Up Volume - Down Volume Difference
RUSSELL 2000 components: Primary Markets only
  • $ADRLD RUSSELL 2000 Advancing Issues - Declining Issues Difference
  • $ADVRL RUSSELL 2000 Advanced issues
  • $DECLRL RUSSELL 2000 Declined issues
  • $DVOLRL RUSSELL 2000 Declined volume
  • $TIKRL RUSSELL 2000 TICK
  • $TRINRL RUSSELL 2000 TRIN
  • $TVOLRL RUSSELL 2000 Total volume
  • $UNCHRL RUSSELL 2000 Unchanged issues
  • $UVOLRL RUSSELL 2000 Advanced volume
  • $VOLRLD RUSSELL 2000 Up Volume - Down Volume Difference
RUSSELL 2000 components: All Markets
  • $ADRLDC RUSSELL 2000 Composite Advancing Issues - Declining Issues Difference
  • $ADVRLC RUSSELL 2000 Composite Advanced issues
  • $DECLRLC RUSSELL 2000 Composite Declined issues
  • $DVOLRLC RUSSELL 2000 Composite Declined volume
  • $TIKRLC RUSSELL 2000 Composite TICK
  • $TRINRLC RUSSELL 2000 Composite TRIN
  • $TVOLRLC RUSSELL 2000 Composite Total volume
  • $UNCHRLC RUSSELL 2000 Composite Unchanged issues
  • $UVOLRLC RUSSELL 2000 Composite Advanced volume
  • $VOLRLDC RUSSELL 2000 Composite Up Volume - Down Volume Difference
All USA stocks: Primary Markets only
  • $ADUSD AllUSA Advancing Issues - Declining Issues Difference
  • $ADVUS AllUSA Advanced issues
  • $DECLUS AllUSA Declined issues
  • $DVOLUS AllUSA Declined volume
  • $TIKUS AllUSA TICK
  • $TRINUS AllUSA TRIN
  • $TVOLUS AllUSA Total volume
  • $UNCHUS AllUSA Unchanged issues
  • $UVOLUS AllUSA Advanced volume
  • $VOLUSD AllUSA Up Volume - Down Volume Difference
All USA stocks: All Markets
  • $ADUSDC AllUSA Composite Advancing Issues - Declining Issues Difference
  • $ADVUSC AllUSA Composite Advanced issues
  • $DECLUSC AllUSA Composite Declined issues
  • $DVOLUSC AllUSA Composite Declined volume
  • $TIKUSC AllUSA Composite TICK
  • $TRINUSC AllUSA Composite TRIN
  • $TVOLUSC AllUSA Composite Total volume
  • $UNCHUSC AllUSA Composite Unchanged issues
  • $UVOLUSC AllUSA Composite Advanced volume
  • $VOLUSDC AllUSA Composite Up Volume - Down Volume Difference
NYSE New Highs/Lows
  • $NYHI1W NYSE New Highs 1W
  • $NYHI2W NYSE New Highs 2W
  • $NYHI1M NYSE New Highs 1M
  • $NYHI3M NYSE New Highs 3M
  • $NYHI6M NYSE New Highs 6M
  • $NYHI9M NYSE New Highs 9M
  • $NYHGH NYSE New Highs 1Y
  • $NYLO1W NYSE New Lows 1W
  • $NYLO2W NYSE New Lows 2W
  • $NYLO1M NYSE New Lows 1M
  • $NYLO3M NYSE New Lows 3M
  • $NYLO6M NYSE New Lows 6M
  • $NYLO9M NYSE New Lows 9M
  • $NYLOW NYSE New Lows 1Y
AMEX New Highs/Lows
  • $AMHI1W NYSE MKT (AMEX) New Highs 1W
  • $AMHI2W NYSE MKT (AMEX) New Highs 2W
  • $AMHI1M NYSE MKT (AMEX) New Highs 1M
  • $AMHI3M NYSE MKT (AMEX) New Highs 3M
  • $AMHI6M NYSE MKT (AMEX) New Highs 6M
  • $AMHI9M NYSE MKT (AMEX) New Highs 9M
  • $AMHGH NYSE MKT (AMEX) New Highs 1Y
  • $AMLO1W NYSE MKT (AMEX) New Lows 1W
  • $AMLO2W NYSE MKT (AMEX) New Lows 2W
  • $AMLO1M NYSE MKT (AMEX) New Lows 1M
  • $AMLO3M NYSE MKT (AMEX) New Lows 3M
  • $AMLO6M NYSE MKT (AMEX) New Lows 6M
  • $AMLO9M NYSE MKT (AMEX) New Lows 9M
  • $AMLOW NYSE MKT (AMEX) New Lows 1Y
NYSE ARCA New Highs/Lows
  • $ARHI1W NYSE ARCA New Highs 1W
  • $ARHI2W NYSE ARCA New Highs 2W
  • $ARHI1M NYSE ARCA New Highs 1M
  • $ARHI3M NYSE ARCA New Highs 3M
  • $ARHI6M NYSE ARCA New Highs 6M
  • $ARHI9M NYSE ARCA New Highs 9M
  • $ARHGH NYSE ARCA New Highs 1Y
  • $ARLO1W NYSE ARCA New Lows 1W
  • $ARLO2W NYSE ARCA New Lows 2W
  • $ARLO1M NYSE ARCA New Lows 1M
  • $ARLO3M NYSE ARCA New Lows 3M
  • $ARLO6M NYSE ARCA New Lows 6M
  • $ARLO9M NYSE ARCA New Lows 9M
  • $ARLOW NYSE ARCA New Lows 1Y
NASDAQ New Highs/Lows
  • $NAHI1W NASDAQ New Highs 1W
  • $NAHI2W NASDAQ New Highs 2W
  • $NAHI1M NASDAQ New Highs 1M
  • $NAHI3M NASDAQ New Highs 3M
  • $NAHI6M NASDAQ New Highs 6M
  • $NAHI9M NASDAQ New Highs 9M
  • $NAHGH NASDAQ New Highs 1Y
  • $NALO1W NASDAQ New Lows 1W
  • $NALO2W NASDAQ New Lows 2W
  • $NALO1M NASDAQ New Lows 1M
  • $NALO3M NASDAQ New Lows 3M
  • $NALO6M NASDAQ New Lows 6M
  • $NALO9M NASDAQ New Lows 9M
  • $NALOW NASDAQ New Lows 1Y
NYSE/ARCA/AMEX/NASDAQ ETFs New Highs/Lows
  • $ETFHI1W ETF New Highs 1W
  • $ETFHI2W ETF New Highs 2W
  • $ETFHI1M ETF New Highs 1M
  • $ETFHI3M ETF New Highs 3M
  • $ETFHI6M ETF New Highs 6M
  • $ETFHI9M ETF New Highs 9M
  • $ETFHGH ETF New Highs 1Y
  • $ETFLO1W ETF New Lows 1W
  • $ETFLO2W ETF New Lows 2W
  • $ETFLO1M ETF New Lows 1M
  • $ETFLO3M ETF New Lows 3M
  • $ETFLO6M ETF New Lows 6M
  • $ETFLO9M ETF New Lows 9M
  • $ETFLOW ETF New Lows 1Y
$SPXA200R now works!

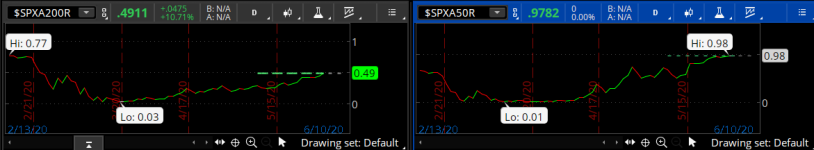
It's the % of stocks above the 200 day SMA.

$SPXA50R is, of course, the 50 day.

I have no idea which other ones work, unfortunately.

15k6RtE.png
 

Attachments

  • 15k6RtE.png
    15k6RtE.png
    44.3 KB · Views: 169
StockCharts Indicator List
  • $BPINDU Dow Bullish %
  • $BPCOMPQ Nasdaq Bullish %
  • $BPNDX Nasdaq 100 Bullish %
  • $BPNYA NYSE Bullish %
  • $BPOEX S&P 100 Bullish %
  • $BPSPX S&P 500 Bullish %
  • $BPDISC Consumer Discretionary Bullish %
  • $BPSTAP Consumer Staples Bullish %
  • $BPENER Energy Bullish %
  • $BPFINA Financials Bullish %
  • $BPHEAL Healthcare Bullish %
  • $BPINDY Industrials Bullish %
  • $BPMATE Materials Bullish %
  • $BPINFO Tech Bullish %
  • $BPTELE Telecom Bullish %
  • $BPUTIL Utilities Bullish %
  • $AMAD AMEX Advancers-Decliners
  • $NAAD Nasdaq Advancers-Decliners
  • $NYAD NYSE Advancers-Decliners
  • $AMHL AMEX New Highs-New Lows
  • $NAHL Nasdaq New Highs-New Lows
  • $NYHL NYSE New Highs-New Lows
  • $NAUD Nasdaq Advance-Decline Volume
  • $NYUD NYSE Advance-Decline Volume
  • $NASI Nasdaq Summation Index
  • $NYSI NYSE Summation Index
  • $CPC Put/Call
  • $DOWA50R Dow % of stocks above 50 MA
  • $DOWA200R Dow % of stocks above 200 MA
  • $NAA50R Nasdaq % of stocks above 50 MA
  • $NAA200R Nasdaq % of stocks above 200 MA
  • $NDXA50R Nas 100 % of stocks above 50 MA
  • $NDXA200R Nas 100 % of stocks above 200 MA
  • $NYA50R NYSE % of stocks above 50 MA
  • $NYA200R NYSE % of stocks above 200 MA
  • $OEXA50R S&P 100 % of stocks above 50 MA
  • $OEXA200R S&P 100 of stocks above 200 MA
  • $SPXA50R S&P 500 % of stocks above 50 MA
  • $SPXA200R S&P 500 % of stocks above 200 MA
 
I'd like to use the MCCLELLAN OSCILLATOR FOR THE NASDAQ 100 but am unable to figure this out as the only options available through think or swim are the NASDAQ, NYSE, AND AMEX indexes for this indicator. I tried swapping NASDAQ with NASDAQ100 in the thinkscript to no avail. Does anyone know the thinkscript language/code for nasdaq100 index?
 
You would need to replace $ADVN/Q and $DECN/Q with $ADVND and $DECLND.
Hey thanks for chiming in Joshua. The thinkscript for the McCllelan Oscillator in thinkorswim does not include $advn/q and/or $DECN/Q.

-----

#
# TD Ameritrade IP Company, Inc. (c) 2009-2021
#

declare lower;

input exchange = {default NYSE, NASDAQ, AMEX};
input fastLength = 19;
input slowLength = 39;
input over_bought = 100;
input over_sold = -100;
input ratioAdjusted = No;

plot McClellanOsc = reference McClellanSummationIndex(exchange = exchange, "fast length" = fastLength, "slow length" = slowLength, "ratio adjusted" = ratioAdjusted).mcClellanOsc;
plot OverBought = over_bought;
plot OverSold = over_sold;
plot ZeroLine = 0;

McClellanOsc.SetDefaultColor(GetColor(1));
OverBought.SetDefaultColor(GetColor(5));
OverSold.SetDefaultColor(GetColor(5));
ZeroLine.SetDefaultColor(GetColor(3));
 
The oscillator code is based on the reference to the summation index, which is a separate study. I might be able to work it out for you later, but I'm about to head out. May I ask why you think you need the index specific breadth variants, rather than the base exchange variants, and why in McClellan format? Anyway, I'll check back in several hours.
 
I see
The oscillator code is based on the reference to the summation index, which is a separate study. I might be able to work it out for you later, but I'm about to head out. May I ask why you think you need the index specific breadth variants, rather than the base exchange variants, and why in McClellan format? Anyway, I'll check back in several hours.
I see where you are coming from now. So I would have to create 2 studies essentially: the first would be a variant of the summation indicator which properly includes the NDX, $ADVND and $DECLND, while the second would be a variant of the oscillator which would include and reference the NDX, which would now be properly included in the summation. I would greatly appreciate your efforts upon coming back from your whereabouts.

And to answer your question, as I understand it; I've chosen to work with indices since the standard as it pertains to these indicators, has been used with indices. But technically, it can actually be used with any basket of stocks I believe.
 
@vgt2101
Code:
declare lower;

input exchange = {default NYSE, NASDAQ, AMEX, NQ_100};
input fastLength = 19;
input slowLength = 39;
input over_bought = 100;
input over_sold = -100;
input ratioAdjusted = No;

def advances;
def declines;
switch (exchange) {
case NYSE:
    advances = close("$ADVN");
    declines = close("$DECN");
case NASDAQ:
    advances = close("$ADVN/Q");
    declines = close("$DECN/Q");
case AMEX:
    advances = close("$ADVA");
    declines = close("$DECA");
case NQ_100:
    advances = close("$ADVND");
    declines = close("$DECLND");
}
def breadth;

    if (ratioAdjusted) {
        breadth = 1000 * (advances - declines) / (advances +
 declines);
    } else {
        breadth = advances - declines;
    }

def emaFastCorr = ExpAverage(CompoundValue(1, if !IsNaN(breadth) then breadth else emaFastCorr[1], 0), fastLength);
def emaSlowCorr = ExpAverage(CompoundValue(1, if !IsNaN(breadth) then breadth else emaSlowCorr[1], 0), slowLength);

plot mcClellanOsc = if !IsNaN(close) then emaFastCorr - emaSlowCorr else Double.NaN; plot OverBought = over_bought;
plot OverSold = over_sold;
plot ZeroLine = 0;

mcClellanOsc.SetDefaultColor(GetColor(1));
OverBought.SetDefaultColor(GetColor(5));
OverSold.SetDefaultColor(GetColor(5));
ZeroLine.SetDefaultColor(GetColor(3));
Thanks Generic! Will try this now and circle back to you accordingly.
 
@vgt2101
Code:
declare lower;

input exchange = {default NYSE, NASDAQ, AMEX, NQ_100};
input fastLength = 19;
input slowLength = 39;
input over_bought = 100;
input over_sold = -100;
input ratioAdjusted = No;

def advances;
def declines;
switch (exchange) {
case NYSE:
    advances = close("$ADVN");
    declines = close("$DECN");
case NASDAQ:
    advances = close("$ADVN/Q");
    declines = close("$DECN/Q");
case AMEX:
    advances = close("$ADVA");
    declines = close("$DECA");
case NQ_100:
    advances = close("$ADVND");
    declines = close("$DECLND");
}
def breadth;

    if (ratioAdjusted) {
        breadth = 1000 * (advances - declines) / (advances +
 declines);
    } else {
        breadth = advances - declines;
    }

def emaFastCorr = ExpAverage(CompoundValue(1, if !IsNaN(breadth) then breadth else emaFastCorr[1], 0), fastLength);
def emaSlowCorr = ExpAverage(CompoundValue(1, if !IsNaN(breadth) then breadth else emaSlowCorr[1], 0), slowLength);

plot mcClellanOsc = if !IsNaN(close) then emaFastCorr - emaSlowCorr else Double.NaN; plot OverBought = over_bought;
plot OverSold = over_sold;
plot ZeroLine = 0;

mcClellanOsc.SetDefaultColor(GetColor(1));
OverBought.SetDefaultColor(GetColor(5));
OverSold.SetDefaultColor(GetColor(5));
ZeroLine.SetDefaultColor(GetColor(3));
Hey it worked! Thanks so much. So instead of doing it in two steps, you did it in one by instead of referencing another indicator, including the various definitions within the thinkscript; is this correct? I'm trying to learn.
 
@vgt2101 The McClellan oscillator only uses the mcClellanOsc from the SummationIndex so I just took what I need from the SummationIndex and added the extra "exchange" and the advancer and decliner issues.

This line of code is from the oscillator and if you look closely at the end, it takes the mcClellanOsc plot from the McClellanSummationIndex indicator.
Code:
plot McClellanOsc = reference McClellanSummationIndex(exchange = exchange, "fast length" = fastLength, "slow length" = slowLength, "ratio adjusted" = ratioAdjusted).mcClellanOsc;
Understood Generic: thank you so much for taking the time to help me with this while also doing some explanation; this is greatly appreciated.
 
@vgt2101 The McClellan oscillator only uses the mcClellanOsc from the SummationIndex so I just took what I need from the SummationIndex and added the extra "exchange" and the advancer and decliner issues.

This line of code is from the oscillator and if you look closely at the end, it takes the mcClellanOsc plot from the McClellanSummationIndex indicator.
Code:
plot McClellanOsc = reference McClellanSummationIndex(exchange = exchange, "fast length" = fastLength, "slow length" = slowLength, "ratio adjusted" = ratioAdjusted).mcClellanOsc;
@generic I was just able to apply your teachings to 3 other indicators and it worked well (thanks again)! But I ran into issues when trying to add the nasdaq 100 (and other indices) to the AdvancedDeclineCumulativeAvg indicator in think or swim. Although another indicator is not referenced within the thinkscript of the AdvancedDeclineCumulativeAvg indicator, I went ahead and tried to find something in the advance/decline indicator to no avail. When you have a minute, do you mind pointing me to the right direction where adding the nasdaq-100 to the AdvancedDeclineCumulativeAvg indicator is concerned?
 
@generic I was just able to apply your teachings to 3 other indicators and it worked well (thanks again)! But I ran into issues when trying to add the nasdaq 100 (and other indices) to the AdvancedDeclineCumulativeAvg indicator in think or swim. Although another indicator is not referenced within the thinkscript of the AdvancedDeclineCumulativeAvg indicator, I went ahead and tried to find something in the advance/decline indicator to no avail. When you have a minute, do you mind pointing me to the right direction where adding the nasdaq-100 to the AdvancedDeclineCumulativeAvg indicator is concerned?
@generic I think I found it. It may be the Advance/Decline Line Daily part of the indicator that stems from the advance/decline indicator. Let me try this again and circle back
 
@generic I think I found it. It may be the Advance/Decline Line Daily part of the indicator that stems from the advance/decline indicator. Let me try this again and circle back
@generic I tried and failed. this is how far I got. error message is value never assigned to advndecl and level:

declare lower;

input exchange = {default NYSE, NASDAQ, AMEX, NQ_100};
input length = 252;

def advnDecnPctChg = 1000 * AdvanceDecline(type = "Advance/Decline Line (Daily)", exchange = exchange);
def cumAdvnDecn = cumAdvnDecn[1] + if !IsNaN(advnDecnPctChg) then advnDecnPctChg else 0;

input type = {default "Advance/Decline Line”, "Advance/Decline Line (Daily)"};

def advances;
def declines;
switch (exchange) {
case NYSE:
advances = close("$ADVN");
declines = close("$DECN");
case NASDAQ:
advances = close("$ADVN/Q");
declines = close("$DECN/Q");
case AMEX:
advances = close("$ADVA");
declines = close("$DECA”);
case NQ_100:
advances = close("$ADVND");
declines = close("$DECLND");
}

def advnDecl;
def level;
switch (type){
case "Advance/Decline Line (Daily)":
advnDecl = (advances - declines) / (advances + declines);
level = 0;
}

plot CumulAD = if !IsNaN(advnDecnPctChg) then cumAdvnDecn else Double.NaN;
plot AvgCumulAD = if !IsNaN(close) then Sum(if !IsNaN(CumulAD) then CumulAD else 0, length) / Sum(if !IsNaN(CumulAD) then 1 else 0, length) else Double.NaN;

CumulAD.DefineColor("Above", Color.UPTICK);
CumulAD.DefineColor("Below", Color.DOWNTICK);
CumulAD.AssignValueColor(if CumulAD > AvgCumulAD then CumulAD.Color("Above") else CumulAD.Color("Below"));
AvgCumulAD.SetDefaultColor(GetColor(7));
 
@vgt2101 You're missing a case for "Advance/Decline Line".
@generic - so that fixed the error message, but nothing plots when i choose nq_100. i get the correct plots for the other three original indices though.

---

declare lower;

input exchange = {default NYSE, NASDAQ, AMEX, NQ_100};
input length = 252;

def advnDecnPctChg = 1000 * AdvanceDecline(type = "Advance/Decline Line (Daily)", exchange = exchange);
def cumAdvnDecn = cumAdvnDecn[1] + if !IsNaN(advnDecnPctChg) then advnDecnPctChg else 0;

input type = {default "Advance/Decline Line”, "Advance/Decline Line (Daily)"};

def advances;
def declines;
switch (exchange) {
case NYSE:
advances = close("$ADVN");
declines = close("$DECN");
case NASDAQ:
advances = close("$ADVN/Q");
declines = close("$DECN/Q");
case AMEX:
advances = close("$ADVA");
declines = close("$DECA”);
case NQ_100:
advances = close("$ADVND");
declines = close("$DECLND");
}

def advnDecl;
def level;
switch (type){
case "Advance/Decline Line (Daily)":
advnDecl = (advances - declines) / (advances + declines);
level = 0;
case "Advance/Decline Line":
advnDecl = advnDecl[1] + if !IsNaN(advances - declines) then advances - declines else 0;
level = 0;
}

plot CumulAD = if !IsNaN(advnDecnPctChg) then cumAdvnDecn else Double.NaN;
plot AvgCumulAD = if !IsNaN(close) then Sum(if !IsNaN(CumulAD) then CumulAD else 0, length) / Sum(if !IsNaN(CumulAD) then 1 else 0, length) else Double.NaN;

CumulAD.DefineColor("Above", Color.UPTICK);
CumulAD.DefineColor("Below", Color.DOWNTICK);
CumulAD.AssignValueColor(if CumulAD > AvgCumulAD then CumulAD.Color("Above") else CumulAD.Color("Below"));
AvgCumulAD.SetDefaultColor(GetColor(7));
 
@vgt2101 You can't pass NQ_100 to AdvanceDecline since NQ_100 isn't an option by default. Problem is starting from your fourth line. I don't have time to help rn, maybe some time tmr or someone else can tag in and fix it.
 
This should be it, you'll need to add which ever levels you want.

Ruby:
declare lower;
input fastLength = 19;
input slowLength = 39;
input ratioAdjusted = No;
def advances = close("$ADVND");
def declines = close("$DECLND");
def breadth;
if (ratioAdjusted) {
    breadth = 1000 * (advances - declines) / (advances + declines);
} else {
    breadth = advances - declines;
}
def emaFastCorr = ExpAverage(CompoundValue(1, if !IsNaN(breadth) then breadth else emaFastCorr[1], 0), fastLength);
def emaSlowCorr = ExpAverage(CompoundValue(1, if !IsNaN(breadth) then breadth else emaSlowCorr[1], 0), slowLength);
def mcClellanOsc = if !IsNaN(close) then emaFastCorr - emaSlowCorr else Double.NaN;
plot OutPut = mcClellanOsc;
@Joshua Hey thanks for circling back to me on this, but it doesn't work for adding the nasdaq-100 (or any other index) to the advancedeclinecumulativeaverage indicator in think or swim. I just got back from a long weekend and will try to work on the script that I sent to @generic last week thursday as he noted something I'll try to focus in on to get somewhere on this.
 

Join useThinkScript to post your question to a community of 21,000+ developers and traders.

Not the exact question you're looking for?

Start a new thread and receive assistance from our community.

87k+ Posts
381 Online
Create Post

The Market Trading Game Changer

Join 2,500+ subscribers inside the useThinkScript VIP Membership Club
  • Exclusive indicators
  • Proven strategies & setups
  • Private Discord community
  • ‘Buy The Dip’ signal alerts
  • Exclusive members-only content
  • Add-ons and resources
  • 1 full year of unlimited support

Frequently Asked Questions

What is useThinkScript?

useThinkScript is the #1 community of stock market investors using indicators and other tools to power their trading strategies. Traders of all skill levels use our forums to learn about scripting and indicators, help each other, and discover new ways to gain an edge in the markets.

How do I get started?

We get it. Our forum can be intimidating, if not overwhelming. With thousands of topics, tens of thousands of posts, our community has created an incredibly deep knowledge base for stock traders. No one can ever exhaust every resource provided on our site.

If you are new, or just looking for guidance, here are some helpful links to get you started.

What are the benefits of VIP Membership?
VIP members get exclusive access to these proven and tested premium indicators: Buy the Dip, Advanced Market Moves 2.0, Take Profit, and Volatility Trading Range. In addition, VIP members get access to over 50 VIP-only custom indicators, add-ons, and strategies, private VIP-only forums, private Discord channel to discuss trades and strategies in real-time, customer support, trade alerts, and much more. Learn all about VIP membership here.
How can I access the premium indicators?
To access the premium indicators, which are plug and play ready, sign up for VIP membership here.
Back
Top