


Non-Repainting Fair Value Gap FVG
mod note:
What the Script Does Well
1. Multi-Timeframe Confluence Visualizer
2. Automated FVG Tracking & Invalidation
3. Noise Filtering via minTicks
4. Efficient Cloud Overlay Approach
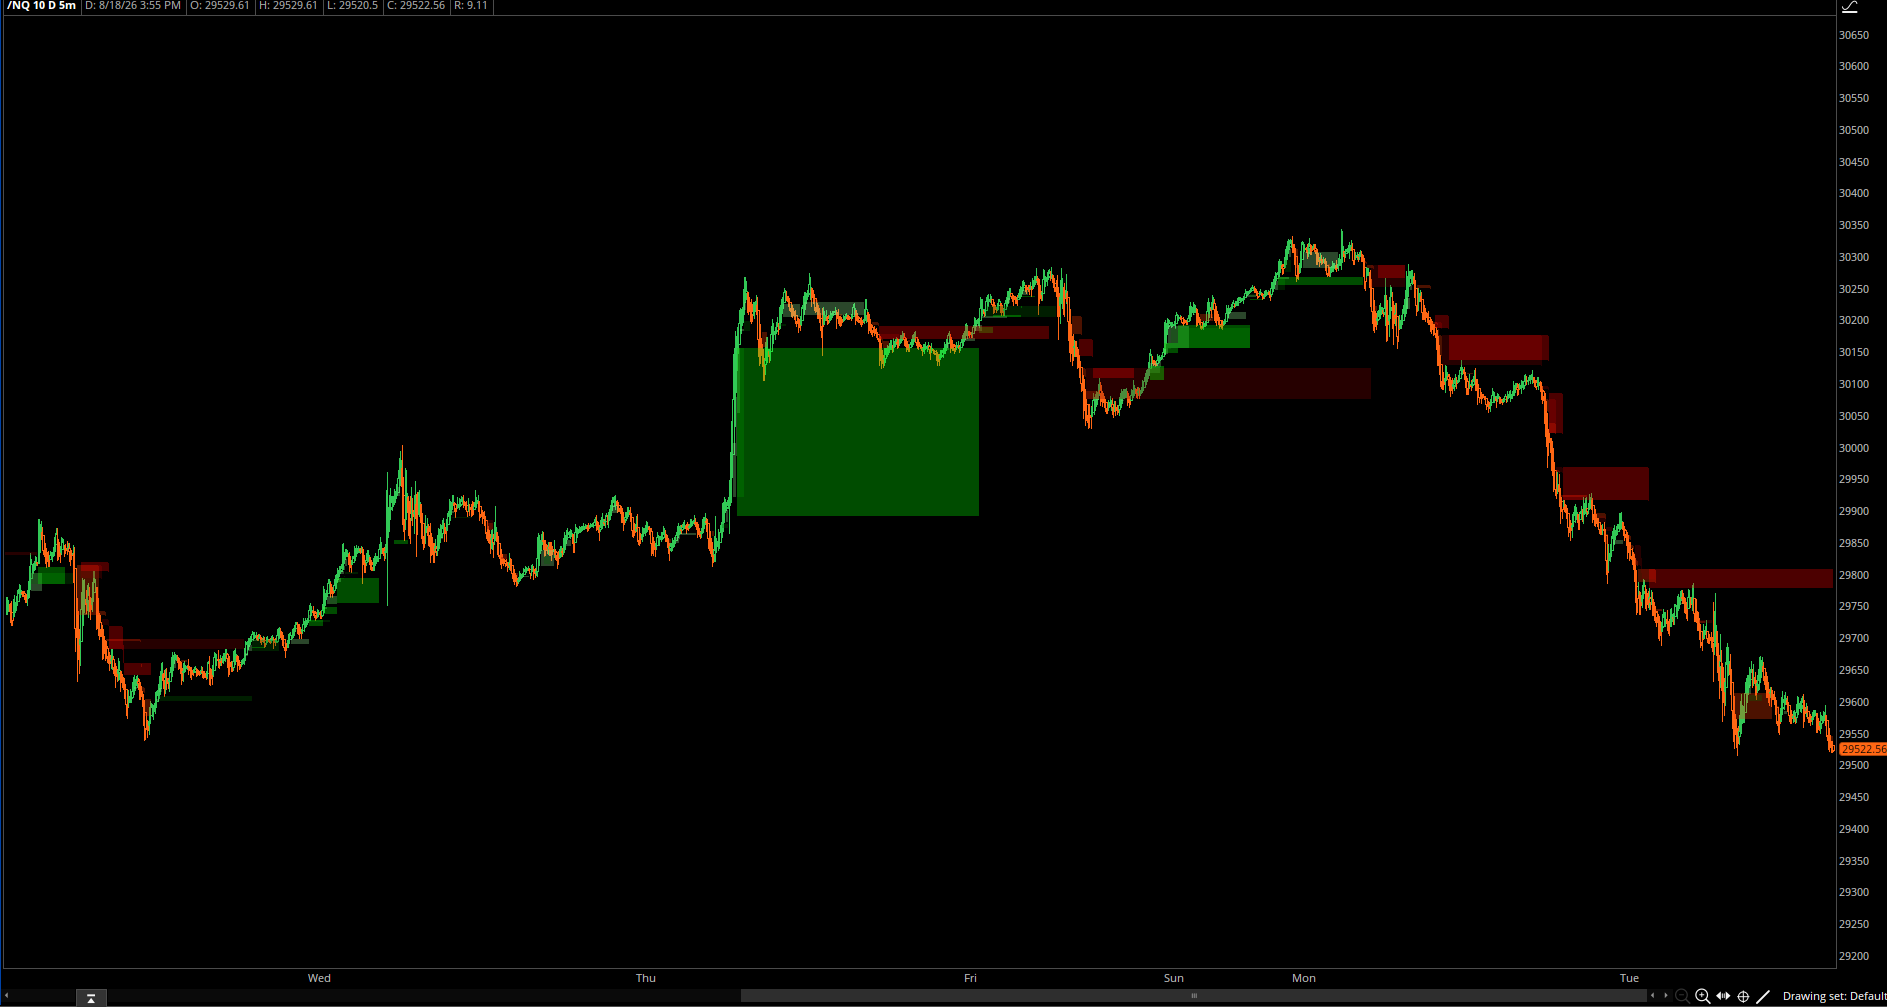
I had AI put this together this morning. I'm not sure if it's measuring correctly or working. It is supposed to measure 15, 30 and 60-minute FVG. I have no math skills but ask AI and keep working on a script so it doesn't throw any error codes.
https://trendspider.com/learning-center/fair-value-gap-trading-strategy/
mod note:
What the Script Does Well
1. Multi-Timeframe Confluence Visualizer
Overlaying 15m, 30m, and 60m Fair Value Gaps directly onto a lower-timeframe chart (like a 1m or 2m) gives intraday traders immediate visibility into key higher-timeframe liquidity gaps without having to constantly flip between chart tabs.
2. Automated FVG Tracking & Invalidation
By implementing state variables (bullFilled15, bearFilled15), the script dynamically removes ("extinguishes") the cloud once price fills or overlaps the gap. This keeps your chart clean by automatically clearing out historic gaps that are no longer active.
3. Noise Filtering via minTicks
The inclusion of input minTicks = 1; ensures micro-gaps (1 tick size) don't clutter your screen, allowing you to set a custom minimum threshold for what constitutes a meaningful market inefficiency.
4. Efficient Cloud Overlay Approach
Using hidden plots (.Hide()) paired with AddCloud() bypasses Thinkorswim's native limits on line clutter and provides clean, clear visual support and resistance zones.
I had AI put this together this morning. I'm not sure if it's measuring correctly or working. It is supposed to measure 15, 30 and 60-minute FVG. I have no math skills but ask AI and keep working on a script so it doesn't throw any error codes.
https://trendspider.com/learning-center/fair-value-gap-trading-strategy/
Code:
# ================================
#   MTF Fair Value Gap (FVG)
#   15-min + 30-min + 1-hour
# ================================

declare upper;

input show15   = yes;
input show30   = yes;
input show60   = yes;
input minTicks = 1;

def ts = TickSize();

# ================================
#   15-MIN DATA + FVG
# ================================
def H15 = high(period = AggregationPeriod.FIFTEEN_MIN);
def L15 = low(period  = AggregationPeriod.FIFTEEN_MIN);

def bullFVG15 = L15 > H15[2] and (L15 - H15[2]) / ts >= minTicks;
def bearFVG15 = H15 < L15[2] and (L15[2] - H15) / ts >= minTicks;

def bullLow15  = if bullFVG15 then L15 else bullLow15[1];
def bullHigh15 = if bullFVG15 then H15[2] else bullHigh15[1];

def bullFilled15 =
    if bullFVG15 then 0
    else if L15 <= bullHigh15 and H15 >= bullLow15 then 1
    else bullFilled15[1];

def bullActive15 = bullFilled15 == 0;

def bearHigh15 = if bearFVG15 then H15 else bearHigh15[1];
def bearLow15  = if bearFVG15 then L15[2] else bearLow15[1];

def bearFilled15 =
    if bearFVG15 then 0
    else if H15 >= bearLow15 and L15 <= bearHigh15 then 1
    else bearFilled15[1];

def bearActive15 = bearFilled15 == 0;

plot B15L = if show15 and bullActive15 then bullLow15 else Double.NaN;
plot B15H = if show15 and bullActive15 then bullHigh15 else Double.NaN;
plot S15L = if show15 and bearActive15 then bearLow15 else Double.NaN;
plot S15H = if show15 and bearActive15 then bearHigh15 else Double.NaN;

B15L.Hide(); B15H.Hide(); S15L.Hide(); S15H.Hide();

AddCloud(B15L, B15H, Color.LIGHT_GREEN, Color.LIGHT_GREEN);
AddCloud(S15L, S15H, Color.LIGHT_RED, Color.LIGHT_RED);

# ================================
#   30-MIN DATA + FVG
# ================================
def H30 = high(period = AggregationPeriod.THIRTY_MIN);
def L30 = low(period  = AggregationPeriod.THIRTY_MIN);

def bullFVG30 = L30 > H30[2] and (L30 - H30[2]) / ts >= minTicks;
def bearFVG30 = H30 < L30[2] and (L30[2] - H30) / ts >= minTicks;

def bullLow30  = if bullFVG30 then L30 else bullLow30[1];
def bullHigh30 = if bullFVG30 then H30[2] else bullHigh30[1];

def bullFilled30 =
    if bullFVG30 then 0
    else if L30 <= bullHigh30 and H30 >= bullLow30 then 1
    else bullFilled30[1];

def bullActive30 = bullFilled30 == 0;

def bearHigh30 = if bearFVG30 then H30 else bearHigh30[1];
def bearLow30  = if bearFVG30 then L30[2] else bearLow30[1];

def bearFilled30 =
    if bearFVG30 then 0
    else if H30 >= bearLow30 and L30 <= bearHigh30 then 1
    else bearFilled30[1];

def bearActive30 = bearFilled30 == 0;

plot B30L = if show30 and bullActive30 then bullLow30 else Double.NaN;
plot B30H = if show30 and bullActive30 then bullHigh30 else Double.NaN;
plot S30L = if show30 and bearActive30 then bearLow30 else Double.NaN;
plot S30H = if show30 and bearActive30 then bearHigh30 else Double.NaN;

B30L.Hide(); B30H.Hide(); S30L.Hide(); S30H.Hide();

AddCloud(B30L, B30H, Color.DARK_GREEN, Color.DARK_GREEN);
AddCloud(S30L, S30H, Color.DARK_RED, Color.DARK_RED);

# ================================
#   1-HOUR DATA + FVG
# ================================
def H60 = high(period = AggregationPeriod.HOUR);
def L60 = low(period  = AggregationPeriod.HOUR);

def bullFVG60 = L60 > H60[2] and (L60 - H60[2]) / ts >= minTicks;
def bearFVG60 = H60 < L60[2] and (L60[2] - H60) / ts >= minTicks;

def bullLow60  = if bullFVG60 then L60 else bullLow60[1];
def bullHigh60 = if bullFVG60 then H60[2] else bullHigh60[1];

def bullFilled60 =
    if bullFVG60 then 0
    else if L60 <= bullHigh60 and H60 >= bullLow60 then 1
    else bullFilled60[1];

def bullActive60 = bullFilled60 == 0;

def bearHigh60 = if bearFVG60 then H60 else bearHigh60[1];
def bearLow60  = if bearFVG60 then L60[2] else bearLow60[1];

def bearFilled60 =
    if bearFVG60 then 0
    else if H60 >= bearLow60 and L60 <= bearHigh60 then 1
    else bearFilled60[1];

def bearActive60 = bearFilled60 == 0;

plot B60L = if show60 and bullActive60 then bullLow60 else Double.NaN;
plot B60H = if show60 and bullActive60 then bullHigh60 else Double.NaN;
plot S60L = if show60 and bearActive60 then bearLow60 else Double.NaN;
plot S60H = if show60 and bearActive60 then bearHigh60 else Double.NaN;

B60L.Hide(); B60H.Hide(); S60L.Hide(); S60H.Hide();

AddCloud(B60L, B60H, Color.GREEN, Color.GREEN);
AddCloud(S60L, S60H, Color.RED, Color.RED);
Last edited by a moderator:


