Hello Community:
I want to find a script that allows me to:
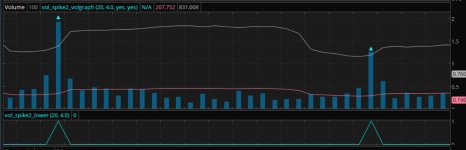
1. search for stocks that have had days with 4x or more than typical volume in a single day relative to average volume in preceding period (upwards, bullish volume).
2. be able to adjust the search time frame to any period - from one day to 360 days ago, or for a period of days, i.e. 90-100 days ago, etc.
3. a price trend line that is either flat or rising both before and after the volume spike
I would appreciate all feedback and references!
thanks,
Realoans
I want to find a script that allows me to:
1. search for stocks that have had days with 4x or more than typical volume in a single day relative to average volume in preceding period (upwards, bullish volume).
2. be able to adjust the search time frame to any period - from one day to 360 days ago, or for a period of days, i.e. 90-100 days ago, etc.
3. a price trend line that is either flat or rising both before and after the volume spike
I would appreciate all feedback and references!
thanks,
Realoans