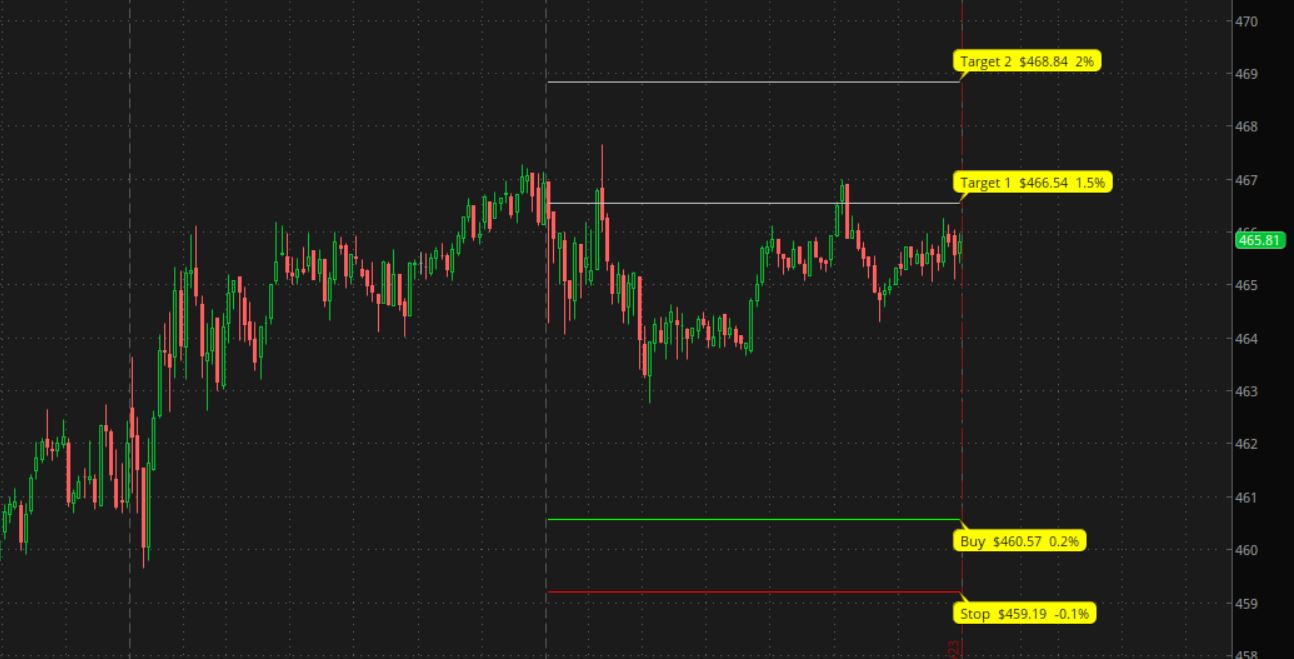
#prev_day_levels_targets

#https://usethinkscript.com/threads/need-help-with-tos-code-writing.16990/
#Need Help with Tos code writing.
#soni1  11/7

# take low and high of previous day.
# take a certain percentage from low and high of day to come up with targets.

# example, Low of day 202.51
#  Buy level would be  low of prev day * 0.2%
#   Stoploss would be  low of prev day * 0.999%
#   Target 1 would be  low of prev day * 1.45%
#   Target 2 would be  low of prev day * 2%

#  So I should be able to Change the low price any time and new targets should be calculated based on percentages i mentioned with lines on the chart.


def na = Double.NaN;
def bn = BarNumber();
def big = 99999;

def istoday = if GetLastDay() == GetDay() then 1 else 0;
def day_last = (istoday and !istoday[-1]);
#addverticalline(day_last, "-", color.cyan);

input buy_per = 0.2;
input stop_per = -0.1;
input target1_per = 1.5;
input target2_per = 2.0;

#input agg = AggregationPeriod.DAY;
#def day_low = low(period = agg);
#def day_high = high(period = agg);

def days_back = 1;
def data_day = (getday() + days_back) == getlastday();

def day_high = if bn == 1 then 0
 else if data_day then max(high, day_high[1])
 else day_high[1];
def day_low = if bn == 1 then big
 else if data_day then min(low, day_low[1])
 else day_low[1];

def target2 = day_low[1] * (1 + (target2_per/100));
def target1 = day_low[1] * (1 + (target1_per/100));
def buy = day_low[1] * (1 + (buy_per/100));
def stop = day_low[1] * (1 + (stop_per/100));

plot zt2 = if istoday then target2 else na;
plot zt1 = if istoday then target1 else na;
plot zb = if istoday then buy else na;
plot zs = if istoday then stop else na;

zt2.SetDefaultColor(Color.light_gray);
zt2.hidebubble();
zt1.SetDefaultColor(Color.light_gray);
zt1.hidebubble();
zb.SetDefaultColor(Color.green);
zb.hidebubble();
zs.SetDefaultColor(Color.red);
zs.hidebubble();

input level_bubbles = yes;
addchartbubble(level_bubbles and day_last, target2, "Target 2  " + asdollars(target2) + "  " + round(target2_per,2) + "%", color.yellow, yes);
addchartbubble(level_bubbles and day_last, target1, "Target 1  " + asdollars(target1)  + "  " + round(target1_per,2) + "%", color.yellow, yes);
addchartbubble(level_bubbles and day_last, buy, "Buy  " + asdollars(buy)  + "  " + round(buy_per,2) + "%", color.yellow, no);
addchartbubble(level_bubbles and day_last, stop, "Stop  " + asdollars(stop)  + "  " + round(stop_per,2) + "%", color.yellow, no);

# ------------------

input test1_prev_low_level = no;
plot zlo = if test1_prev_low_level and istoday then day_low else na;
zlo.SetStyle(Curve.MEDIUM_DASH);
zlo.SetDefaultColor(Color.magenta);
# .setlineweight(1);

input test2_data_day_levels = no;
plot z1 = if test2_data_day_levels and day_high > 0 and data_day then day_high else na;
plot z2 = if test2_data_day_levels and day_low < big and data_day then day_low else na;
#

