I read somewhere that one of the cons of using Williams Alligator is that it is a lagging indicator based on smoothed moving averages, causing delayed entries and exits.
I really liked using the Alligator but recalling the potential for late entries got me to thinking that maybe this indicator could be made better by removing the lag.
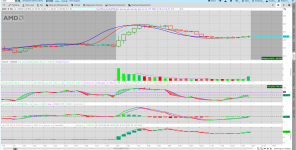
So I replaced the moving averages with Dr Ehlers Instantaneous Trend Lines (ITrend).
But the results were not as promising as I hoped. The following screenshot shows the ITrend variant of the Williams Alligator wakes up to feed pretty much as late as the standard alligator does.
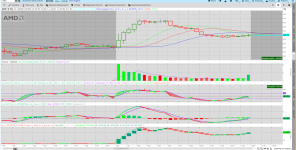
The second screenshot shows the standard Williams Alligator applied to the same data, missing the opening wave entirely.
Perhaps there is a better way to reduce the lag...

The following screenshot shows the regular Williams Alligator, which does indeed appear to open up too late, at least in this example.

I really liked using the Alligator but recalling the potential for late entries got me to thinking that maybe this indicator could be made better by removing the lag.
So I replaced the moving averages with Dr Ehlers Instantaneous Trend Lines (ITrend).
But the results were not as promising as I hoped. The following screenshot shows the ITrend variant of the Williams Alligator wakes up to feed pretty much as late as the standard alligator does.
The second screenshot shows the standard Williams Alligator applied to the same data, missing the opening wave entirely.
Perhaps there is a better way to reduce the lag...
The following screenshot shows the regular Williams Alligator, which does indeed appear to open up too late, at least in this example.
CSS:
# Near Zero-Lag Williams Alligator Using the Dr Ehlers ITrend

#*** ITrend with virtually zero lag from CH2-3 of "Cybernetic Analysis for Stocks and
# Futures" by Dr Ehlers. It subtracts a High-Pass Filter (HPF) from the data to get the low frequency
# data containing the trend. And since HPFs have virtually no lag, this ITrend is virtually
# zero lag.


declare upper;

input Show_Cycle = yes;
input ShowITRENDDC = yes;
input ShowITRENDfast = yes;
input ShowITRENDslow = yes;

input Show_CrossOver = yes;
input Show_fastTrigger = yes;
input Show_slowTrigger = yes;
input ShowHMA = no;
input showlabels = no;
input OpenTime = 0715;
input CloseTime = 1600;
input MinutesPerBar = 15;


#****** The Dr Ehlers ITrend, per CH 2-3 of "Cybernetic analysis for Stocks and Futures",
# has essentially no lag since it is a HPF subtracted from the price data.
# Refer to Figure 3.6 for the code:

script getITrend {
    input Price = HL2;
    input Length = 20;

    def alpha = 2 / (Length + 1);
    def ITrend = CompoundValue(6,
                 (alpha - alpha * alpha / 4) * Price +
                 .5 * alpha * alpha * Price[1] -
                 (alpha - .75 * alpha * alpha) * Price[2] +
                 2 * (1 - alpha) * ITrend[1] -
                 (1 - alpha) * (1 - alpha) * ITrend[2],
            (Price + 2 * Price[1] + Price[2]) / 4);

    plot Trend = ITrend;

} # End Script getItrend{}

#===============================================
input price = HL2;
input Jaw = 13;
input Teeth = 8;
input Lips = 5;

def ITrend_JAW = getITrend(price[8], Jaw);
def ITrend_TEETH = getITrend(price[5], Teeth);
def ITrend_LIPS = getITrend(price[3], Lips);

#PLOTS

plot pJAW = ITrend_JAW;
pJAW.SetLineWeight(2);
pJAW.HideBubble();
pJAW.AssignValueColor(Color.BLUE);

plot pTEETH = ITrend_TEETH;
pTEETH.SetLineWeight(2);
pTEETH.HideBubble();
pTEETH.AssignValueColor(Color.RED);

plot pLIPS = ITrend_LIPS;
pLIPS.SetLineWeight(2);
pLIPS.HideBubble();
pLIPS.AssignValueColor(Color.CYAN);
Attachments
Last edited: