


mod note:
At its core, this script gives you three things:
A smooth, non‑repainting estimate of price (KernelEst)
Using Nadaraya–Watson regression (three flavors: Quadratic, Lux, Super), you’re getting a locally weighted, non‑parametric fair value curve instead of a simple moving average.
Adaptive volatility bands around that estimate (ATR‑based envelope)
ATR is computed on the kernel‑smoothed high/low/close, then multiplied into near/far bands. So the envelope expands and contracts with regime volatility, not just raw price noise.
Stateful trend and signal logic (color lag + signal lag)
Trend color changes only after sustained moves (ColorLag), and entry/exit signals only fire after sustained band interaction (SignalLag). That’s behavioral safety baked into the math.
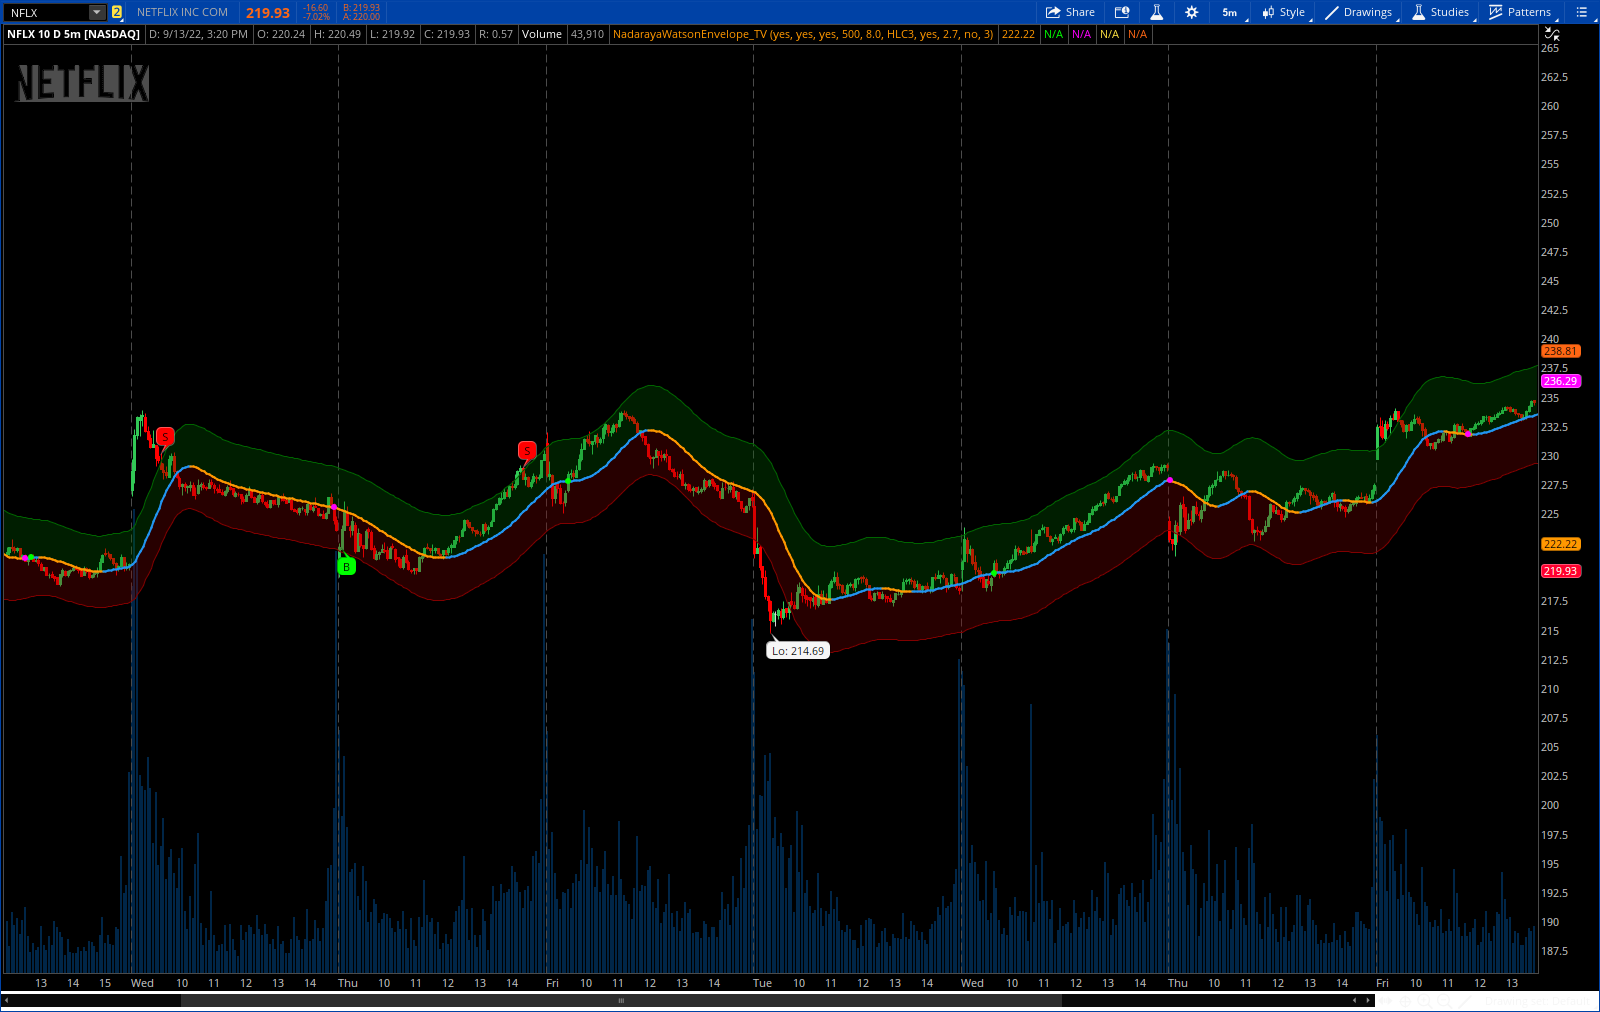
this is non repaint Nadaraya Watson Envelope. Not exact lux repaint indicator. try it!
CODE Update V3.0 -
# v3.0 Some code fixes, change on band style and added option for signal wait bar - 11/2022
CODE:
V 2.0
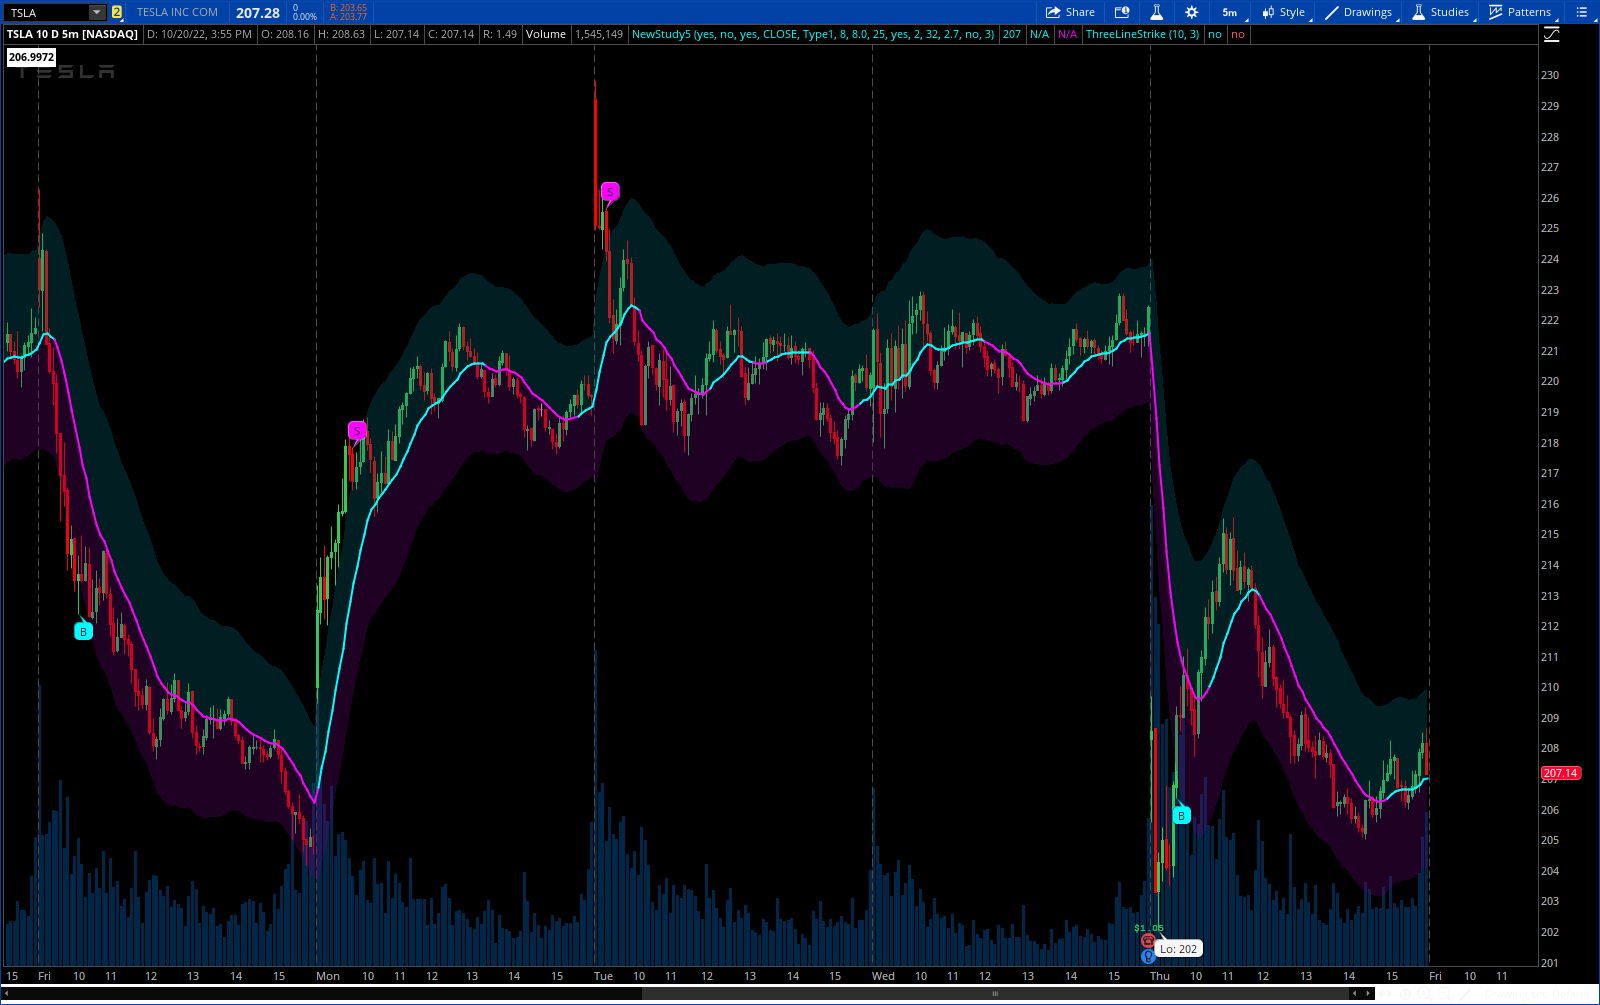
Updated Code:
Update - V2.5
added super Nadaraya calc method. You can try all options from the same code below.
At its core, this script gives you three things:
A smooth, non‑repainting estimate of price (KernelEst)
Using Nadaraya–Watson regression (three flavors: Quadratic, Lux, Super), you’re getting a locally weighted, non‑parametric fair value curve instead of a simple moving average.
Adaptive volatility bands around that estimate (ATR‑based envelope)
ATR is computed on the kernel‑smoothed high/low/close, then multiplied into near/far bands. So the envelope expands and contracts with regime volatility, not just raw price noise.
Stateful trend and signal logic (color lag + signal lag)
Trend color changes only after sustained moves (ColorLag), and entry/exit signals only fire after sustained band interaction (SignalLag). That’s behavioral safety baked into the math.
this is non repaint Nadaraya Watson Envelope. Not exact lux repaint indicator. try it!
CODE Update V3.0 -
# v3.0 Some code fixes, change on band style and added option for signal wait bar - 11/2022
CSS:
#// This source code is subject to the terms of the Mozilla Public License 2.0 at https://mozilla.
#// The non-repainting implementation of Nadaraya–Watson Regression using a Rational Quadratic Kernel is an original idea from @jdehorty i added the upper band an lower band using ATR, with this
#// we get an aproximation of Nadaraya-Watson Envelope
#indicator('Nadaraya-Watson non repainting', overlay=true, timeframe="")
# Converted and mod by Sam4Cok@Samer800 - 10/2022
# v2.0 Add 2 methods of calculating NW. Both non repating.
# v2.5 Added super NW. All calc typs are non repating - 11 / 2022.
# v3.0 Some code fixes, change on band style and added option for signal wait bar - 11/2022
input ShowBubble = yes;
input ShowBandLines = yes;
input ShowCloud  = yes;
input src = close;
input SmaplePeriod = 50;
input NadarayaType = {default Quadratic, Lux, Super};
input SignalStyle  = {Default Bubbles, Arrows, None};
input LookbackWindow = 8;      # The number of bars used for the estimation. Recommended range: 3-50
input RelativeWeighting = 8.0; # Relative weighting of time frames. Recommended Range: 0.25-25
input RegressionStartBar = 25; # Bar index on which to start regression. Recommended range: 5-25
input ColorLag = 1;            # This often results in less color transitions overall.
input SignalLag = 3;           # Lag for crossover detection. Lower values result in earlier crossovers.
input AtrPeriod = 60;          # ATR Period
input MultiForNearBand = 1.5;  # Multiplier for near band.
input MultiForFarBand  = 7.0;  # Multiplier for far band.
input smoothing = no;
input smoothLength = 3;

def na = Double.NaN;
def h = high;
def l = low;
def CalcType = if NadarayaType==NadarayaType.Quadratic then 1 else
               if NadarayaType==NadarayaType.Lux then 2 else 0;
def CalcPeriod = min(SmaplePeriod + 500, 750);
def Sample     = min(SmaplePeriod, 500);
def size = if CalcType==0 then sample else CalcPeriod;
def style= if SignalStyle.Bubbles then 1 else
           if SignalStyle.Arrows then -1 else 0;
#kernel_atr(length, _high, _low, _close) =>
script kernel_atr {
  input length = 60;
  input _high = high;
  input _low = low;
  input _close = close;
    def tr = if isNaN(_high[1]) then _high - _low else TrueRange(_high,_close,_low);
    plot kATR = WildersAverage(tr, length);
}
#-- counter
script counter {
    input length = 500;
    input Bandwidth = 8;
    def counter = fold i = 0 to length - 1 with p do
              p +  Exp(-(Power(i,2)/(Bandwidth*Bandwidth*2)));
    plot result = counter;
}
#super(src, len) =>
script super {
input src = close;
input len = 50;
    def f = (1.414 * Double.Pi)/len;
    def a = exp(-f);
    def c2 = 2 * a * cos(f);
    def c3 = -a * a;
    def c1 = 1 - c2 - c3;
    def smooth;
    smooth = c1 * (src+src[1]) * 0.5 + c2 * (smooth[1]) + c3 * (smooth[2]);
plot return = smooth;
}
#kernel_regression1(_src, _size, LookbackWindow, RegressionStartBar, RelativeWeighting) =>
script kernel {
   input _src = close;
   input _size = 500;
   input _h = 8;
   input x_0 = 2;
   input r = 8;
    def _currentWeight;
    def _cumulativeWeight;
    _currentWeight = fold i = 0 to _size + x_0 with p do
        p + GetValue(_src, i) * Power(1 + (Power(i, 2) / ((Power(_h, 2) * 2 * r))), -r);
    _cumulativeWeight = fold j = 0 to  _size + x_0 with q do
        q + Power(1 + (Power(j, 2) / ((Power(_h, 2) * 2 * r))), -r);
    plot currentWeight = _currentWeight / _cumulativeWeight;
}
script Lux {
    input src = close;
    input size = 500;
    input LookbackWindow = 8;
        def sum;
        def sumw;
        def y2;
        def Bandwidth = LookbackWindow;
        sum  = fold j = 0 to size-1 with p do
           p +  src[j] *  Exp(-(Power(counter(size, Bandwidth)-j,2)/(Bandwidth*Bandwidth*2)));
        sumw = fold k = 0 to size-1 with q do
           q + Exp(-(Power(counter(size,Bandwidth)-k,2)/(Bandwidth*Bandwidth*2)));
        y2 = sum/sumw;
    plot YNW = y2;
}
# //----Type 1 Calc
def kerSrc1 = kernel(src, size, LookbackWindow, RegressionStartBar, RelativeWeighting);
def kerHi1 = kernel(h, size, LookbackWindow, RegressionStartBar, RelativeWeighting);
def kerLo1 = kernel(l, size, LookbackWindow, RegressionStartBar, RelativeWeighting);
def nwHigh1 = if !Smoothing then kerHi1 else WMA(kerHi1, smoothLength);
def nwLow1  = if !Smoothing then kerLo1 else WMA(kerLo1, smoothLength);
def nwSrc1  = if !Smoothing then kerSrc1 else WMA(kerSrc1, smoothLength);;
# //--- Type 2 Calc
def luxSrc2  = Lux(src, size, LookbackWindow);
def luxHigh2 = Lux(h,size, LookbackWindow);
def luxLow2  = Lux(l,size, LookbackWindow);
def nwHigh2  = if !Smoothing then luxHigh2 else WMA(luxHigh2,smoothLength);
def nwLow2   = if !Smoothing then luxLow2 else WMA(luxLow2,smoothLength);
def nwSrc2   = if !Smoothing then luxSrc2 else WMA(luxSrc2,smoothLength);
# //------Type3 Calc
def SupHi3 = super(h, size);
def SupLo3 = super(l, size);
def SupSrc3 = super(src, size);
def nwHigh3 = if !Smoothing then SupHi3 else WMA(SupHi3, smoothLength);
def nwLow3  = if !Smoothing then SupLo3 else WMA(SupLo3, smoothLength);
def nwSrc3  = if !Smoothing then SupSrc3 else WMA(SupSrc3, smoothLength);

#// Plot
def KernelHi = if CalcType == 1 then nwHigh1 else
               if CalcType == 2 then nwHigh2 else nwHigh3;    # Nadaraya-Watson Estimate - High
def KernelLo = if CalcType == 1 then nwLow1 else
               if CalcType == 2 then nwLow2 else nwLow3;      # Nadaraya-Watson Estimate - Low
def KernelEst =if CalcType == 1 then nwSrc1 else
               if CalcType == 2 then nwSrc2 else nwSrc3;     # Nadaraya-Watson Estimate - src
#// Trend

def isBullish = KernelEst > KernelEst[1];
def isBearish = KernelEst < KernelEst[1];
def isBullishCount = if isBullish then isBullishCount[1] + 1 else 0;
def isBearishCount = if isBearish then isBearishCount[1] + 1 else 0;
def isBullishCross = isBullishCount>=ColorLag;
def isBearishCross = isBearishCount>=ColorLag;

def plotColor = if isBullish then isBullishCross else
                if isBearish then isBearishCross else 0;
#--- Plots
plot nwEst = KernelEst;
nwEst.AssignValueColor(if plotColor==isBullishCross then CreateColor(0, 255, 255) else
                       if plotColor==isBearishCross then CreateColor(255, 0, 255) else Color.GRAY);
nwEst.SetLineWeight(2);

#--- Band Cals
def nATR = kernel_atr(AtrPeriod, KernelHi, KernelLo, KernelEst);
  def _upper_far  = KernelEst + MultiForFarBand * natr;
  def _upper_near = KernelEst + MultiForNearBand  * natr;
  def _lower_near = KernelEst - MultiForNearBand  * natr;
  def _lower_far  = KernelEst - MultiForFarBand * natr;
  def _upper_avg = (_upper_far + _upper_near) / 2;
  def _lower_avg = (_lower_far + _lower_near) / 2;

plot upNear = _upper_near;
plot upMid  = _upper_avg;
plot upFar  = _upper_far;
plot loNear = _lower_near;
plot loMid  = _lower_avg;
plot loFar  = _lower_far;

upNear.SetHiding(!ShowBandLines);
upMid.SetHiding(!ShowBandLines);
upFar.SetHiding(!ShowBandLines);
loNear.SetHiding(!ShowBandLines);
loMid.SetHiding(!ShowBandLines);
loFar.SetHiding(!ShowBandLines);
upNear.SetDefaultColor(CreateColor(94,0,0));
upMid.SetDefaultColor(CreateColor(94,0,0));
upFar.SetDefaultColor(CreateColor(94,0,0));
loNear.SetDefaultColor(CreateColor(1,31,20));
loMid.SetDefaultColor(CreateColor(1,31,20));
loFar.SetDefaultColor(CreateColor(1,31,20));

#----- Signal
def SigU = src > loMid;
def SigD = src < upMid;
def SigUCount = if SigU then SigUCount[1] + 1 else 0;
def SigDCount = if SigD then SigDCount[1] + 1 else 0;
def SigUp = SigU and SigUCount== SignalLag;
def SigDn = SigD and SigDCount== SignalLag;

plot ArrowUp = if (SigUp and style<0) then l else na;
plot ArrowDn = if (SigDn and style<0) then h else na;
ArrowUp.SetPaintingStrategy(PaintingStrategy.ARROW_UP);
ArrowDn.SetPaintingStrategy(PaintingStrategy.ARROW_DOWN);


#------ CLOUD---
AddCloud(if ShowCloud then upFar else na, upMid, CreateColor(94,0,0));
AddCloud(if ShowCloud then upFar else na, upNear,CreateColor(94,0,0));

AddCloud(if ShowCloud then loMid else na, loFar, CreateColor(1,31,20));
AddCloud(if ShowCloud then loNear else na, loFar,CreateColor(1,31,20));

#------ Bubbles
AddChartBubble(style>0 and SigUp, l, "B", CreateColor(0, 255, 255), no);
AddChartBubble(style>0 and SigDn, h, "S", CreateColor(255, 0, 255), yes);

#---- END
CSS:
# Not typical converstion of "Nadaraya-Watson Envelope [LUX]"
# #'Nadaraya-Watson Non with non Repaint option'
# Mod by Sam4cok@samer800 - 09/2022

input ShowBand = yes;
input ShowSignal = yes;
input ShowBubble = yes;
input length = 500;
input Bandwidth = 8.0;    # 'Bandwidth'
input src = hlc3;
input lag = yes;
input mult = 2.7;         # "Multiplier"
input smooth = no;
input smoothLength = 3;

def na = Double.NaN;

script counter {
    input length = 500;
    input Bandwidth = 8;
    def counter = fold i = 0 to length - 1 with p do
              p +  Exp(-(Power(i,2)/(Bandwidth*Bandwidth*2)));
    plot result = counter;
}
def sum;
def mae;
def sumw;
def sum_e;
def y2;

    sum  = fold j = 0 to length-1 with p do
           p +  src[j] *  Exp(-(Power(if lag then counter(length, Bandwidth)-j else
                j,2)/(Bandwidth*Bandwidth*2)));

    sumw = fold k = 0 to length-1 with q do
           q + Exp(-(Power(if lag then counter(length,Bandwidth)-k else k,2)/(Bandwidth*Bandwidth*2)));

    y2 = if smooth then Average(sum/sumw, smoothLength) else (sum/sumw);

    sum_e = fold i = 0 to length-1 with r do
                r + absValue(src[i] - y2[i]);

    mae = if smooth then Average(sum_e/length*mult, smoothLength) else sum_e / length*mult;

    def mcol = if y2>y2[1] and y2[1]>y2[2] then 1 else 0;

    def SMAUp = y2 + mae;# "Upper"
    def SMALo = y2 - mae;# "Lower"

    plot middle = y2;    # "Midle"

    middle.AssignValueColor( if mcol then CreateColor(33, 150, 243) else CreateColor(255, 152, 0));
    middle.SetLineWeight(2);

addcloud(if ShowBand then SMAUp else na,middle, Color.DARK_GREEN, Color.DARK_RED, yes);
addcloud(if ShowBand then middle else na, SMALo, Color.DARK_RED, Color.DARK_RED, yes);
#---------------------------------------------
    def up = If(src crosses above y2 and  mcol and src[1]>open[1], middle, na);
    def dn = If(src crosses below y2 and !mcol and src[1]<open[1], middle, na);

    plot SigUp = up;
         SigUp.SetHiding(!ShowSignal);
    plot SigDn = dn;
         SigDn.SetHiding(!ShowSignal);
    SigUp.SetLineWeight(3);
    SigDn.SetLineWeight(3);
    SigUp.SetDefaultColor(Color.GREEN);
    SigDn.SetDefaultColor(Color.MAGENTA);
    SigUp.SetPaintingStrategy(PaintingStrategy.POINTS);
    SigDn.SetPaintingStrategy(PaintingStrategy.POINTS);

    plot bandUp = if src>SMALo and src[1]<SMALo then low else na;
    plot bandDn = if src<SMAUp and src[1]>SMAUp then high else na;

AddChartBubble(ShowBubble and bandUp, bandUp, "B", Color.GREEN, no);
AddChartBubble(ShowBubble and bandDn, bandDn, "S", Color.RED, yes);

#### END
V 2.0
Nadaraya-Watson Envelope - Non Repaint
added 2 type of NW calculation methods to select from. Type1 based on ATR band the other one based on LUX modified code.Updated Code:
CSS:
#// This source code is subject to the terms of the Mozilla Public License 2.0 at https://mozilla.
#// © Lupown
#// The non-repainting implementation of Nadaraya–Watson Regression using a Rational Quadratic Kernel is an original idea from @jdehorty i added the upper band an lower band using ATR, with this
#// we get an aproximation of Nadaraya-Watson Envelope
#indicator('Nadaraya-Watson non repainting', overlay=true, timeframe="")
# Converted and mod by Sam4Cok@Samer800 - 10/2022
# v2.0 Add 2 methods of calculating NW. Both non repating.
input ShowBubble = yes;
input ShowBand   = yes;
input ShowCloud  = no;
input src = close;#, 'Source')
input NadarayaType = {default Type1, Type2};
input LookbackWindow = 8; # The number of bars used for the estimation. Recommended range: 3-50
input RelativeWeighting = 8.0;# Relative weighting of time frames. Recommended Range: 0.25-25
input RegressionStartBar = 25;# Bar index on which to start regression. Recommended range: 5-25
input smoothColors = no; # This often results in less color transitions overall.
input lag = 2;# "Lag for crossover detection. Lower values result in earlier crossovers.
input AtrPeriod = 32;#, "ATR Period")
input Multiplier = 2.7;#,"Multiplier")
input smoothing = no;
input smoothLength = 3;

def na = Double.NaN;
def size = if !IsNaN(close[1]) then size[1] + 1 else size[1];

script counter {
    input length = 500;
    input Bandwidth = 8;
    def counter = fold i = 0 to length - 1 with p do
              p +  Exp(-(Power(i,2)/(Bandwidth*Bandwidth*2)));
    plot result = counter;
}
def o = open;
def h = high;
def l = low;

#kernel_regression1(_src, _size, LookbackWindow, RegressionStartBar, RelativeWeighting) =>
script kernel_regression1 {
    input _src = close;
    input _size = 500;
    input _h = 8;
    input x_0 = 2;
    input r = 8;
    def _currentWeight;
    def _cumulativeWeight;
    _currentWeight = fold i = 0 to _size + x_0 with p do
        p + GetValue(_src, i) * Power(1 + (Power(i, 2) / ((Power(_h, 2) * 2 * r))), -r);
    _cumulativeWeight = fold j = 0 to  _size + x_0 with q do
        q + Power(1 + (Power(j, 2) / ((Power(_h, 2) * 2 * r))), -r);
    plot currentWeight = _currentWeight;
    plot cumulativeWeight = _cumulativeWeight;
}
def sum;
def mae;
def sumw;
def sum_e;
def y2;
def length = 500;
def Bandwidth = LookbackWindow;
    sum  = fold j = 0 to length-1 with p do
           p +  src[j] *  Exp(-(Power(if lag then counter(length, Bandwidth)-j else
                j,2)/(Bandwidth*Bandwidth*2)));

    sumw = fold k = 0 to length-1 with q do
           q + Exp(-(Power(if lag then counter(length,Bandwidth)-k else k,2)/(Bandwidth*Bandwidth*2)));

    y2 = if smoothing then Average(sum/sumw, smoothLength) else (sum/sumw);

    sum_e = fold i = 0 to length-1 with r do
                r + absValue(src[i] - y2[i]);

    mae = if smoothing then Average(sum_e/length*Multiplier, smoothLength) else sum_e / length*Multiplier;

#def mcol = if y2 > y2[1] and y2[1] > y2[2] then 1 else 0;

def currentWeight1 = kernel_regression1(src, size, LookbackWindow, RegressionStartBar, RelativeWeighting).currentWeight;
def cumulativeWeight1 = kernel_regression1(src, size, LookbackWindow, RegressionStartBar, RelativeWeighting).cumulativeWeight;
def currentWeight2 = kernel_regression1(src, size, LookbackWindow - lag, RegressionStartBar, RelativeWeighting).currentWeight;
def cumulativeWeight2 = kernel_regression1(src, size, LookbackWindow - lag, RegressionStartBar, RelativeWeighting).cumulativeWeight;

def yhat1 = currentWeight1 / cumulativeWeight1;
def yhat2 = currentWeight2 / cumulativeWeight2;

#// Rates of Change
def wasBearish = yhat1[2] > yhat1[1];
def wasBullish = yhat1[2] < yhat1[1];
def isBearish  = yhat1[1] > yhat1;
def isBullish  = yhat1[1] < yhat1;
def isBearishChange = isBearish and wasBullish;
def isBullishChange = isBullish and wasBearish;

#// Crossovers
def isBullishCross = Crosses(yhat2, yhat1, CrossingDirection.ABOVE);
def isBearishCross = Crosses(yhat2, yhat1, CrossingDirection.BELOW);
def isBullishSmooth = yhat2 > yhat1;
def isBearishSmooth = yhat2 < yhat1;

#// Colors
def colorByCross = if isBullishSmooth then 1 else 0;
def colorByRate = if isBullish then 1 else 0;
def plotColor = if NadarayaType == NadarayaType.Type1 then
                if smoothColors then colorByCross else colorByRate else
                if y2 > y2[1] and y2[1] > y2[2] then 1 else 0;

#// Plot
def KernelEst = if NadarayaType == NadarayaType.Type1 then
            If(smoothing, WMA(yhat1, smoothLength), yhat1) else y2;# "Rational Quadratic Kernel Estimate"
plot RQKernelEst = KernelEst;
RQKernelEst.AssignValueColor(if plotColor then CreateColor(0, 255, 255) else CreateColor(255, 0, 255));
RQKernelEst.SetLineWeight(2);

def upperBand = if NadarayaType == NadarayaType.Type1 then
                RQKernelEst + Multiplier * ATR(AtrPeriod) else y2 + mae;
def lowerBand = if NadarayaType == NadarayaType.Type1 then
                RQKernelEst - Multiplier * ATR(AtrPeriod) else y2 - mae;

plot upperje = if ShowBand then upperBand else na;    # "Rational Quadratic Kernel Upper"
plot lowerje = if ShowBand then lowerBand else na;    # "Rational Quadratic Kernel Lower"
upperje.SetDefaultColor(CreateColor(0, 255, 255));
lowerje.SetDefaultColor(CreateColor(255, 0, 255));

#/plot(yhat1 + multi, "Rational Quadratic Kernel Estimate", color=color.silver, linewidth=2)
def SigUp = Crosses(close, lowerBand, CrossingDirection.ABOVE);#,char = "🥀", location = location.abovebar)
def SigDn = Crosses(close, upperBand, CrossingDirection.BELOW);#,char = "🍀",location = location.belowbar)

#------ CLOUD---
AddCloud(if ShowCloud then upperBand else na, RQKernelEst, CreateColor(4, 103, 117));
AddCloud(if ShowCloud then RQKernelEst else na, lowerBand, CreateColor(100, 2, 117));

#------ Bubbles
AddChartBubble(ShowBubble and SigUp, low, "B", CreateColor(0, 255, 255), no);
AddChartBubble(ShowBubble and SigDn, high, "S", CreateColor(255, 0, 255), yes);

#### END
Update - V2.5
added super Nadaraya calc method. You can try all options from the same code below.
CSS:
#// This source code is subject to the terms of the Mozilla Public License 2.0 at https://mozilla.
#// The non-repainting implementation of Nadaraya–Watson Regression using a Rational Quadratic Kernel is an original idea from @jdehorty i added the upper band an lower band using ATR, with this
#// we get an aproximation of Nadaraya-Watson Envelope
#indicator('Nadaraya-Watson non repainting', overlay=true, timeframe="")
# Converted and mod by Sam4Cok@Samer800 - 10/2022
# v2.0 Add 2 methods of calculating NW. Both non repating.
# v2.5 added super NW. All calc typs are non repating - 11 / 2022.
input ShowBubble = yes;
input ShowBand   = yes;
input ShowCloud  = no;
input SmaplePeriod = 50;
input src = close;#, 'Source')
input NadarayaType = {Quadratic, Lux,default Super};
input LookbackWindow = 8; # The number of bars used for the estimation. Recommended range: 3-50
input RelativeWeighting = 8.0;# Relative weighting of time frames. Recommended Range: 0.25-25
input RegressionStartBar = 25;# Bar index on which to start regression. Recommended range: 5-25
input smoothColors = no; # This often results in less color transitions overall.
input lag = 2;# "Lag for crossover detection. Lower values result in earlier crossovers.
input AtrPeriod = 32;#, "ATR Period")
input Multiplier = 2.7;#,"Multiplier")
input smoothing = no;
input smoothLength = 3;

def na = Double.NaN;
def o = open;
def h = high;
def l = low;
def c = close;
def CalcType = if NadarayaType==NadarayaType.Quadratic then 1 else
               if NadarayaType==NadarayaType.Lux then 2 else 0;
def CalcPeriod = min(SmaplePeriod + 500, 750);
def size = CalcPeriod;
script counter {
    input length = 500;
    input Bandwidth = 8;
    def counter = fold i = 0 to length - 1 with p do
              p +  Exp(-(Power(i,2)/(Bandwidth*Bandwidth*2)));
    plot result = counter;
}
#super(src, len) =>
script super {
input src = close;
input len = 50;
    def f = (1.414 * Double.Pi)/len;
    def a = exp(-f);
    def c2 = 2 * a * cos(f);
    def c3 = -a*a;
    def c1 = 1-c2-c3;
    def smooth;;
    smooth = c1 * (src+src[1]) * 0.5 + c2 * (smooth[1]) + c3 * (smooth[2]);
plot return = smooth;
}
#kernel_regression1(_src, _size, LookbackWindow, RegressionStartBar, RelativeWeighting) =>
script kernel {
    input _src = close;
    input _size = 500;
    input _h = 8;
    input x_0 = 2;
    input r = 8;
    def _currentWeight;
    def _cumulativeWeight;
    _currentWeight = fold i = 0 to _size + x_0 with p do
        p + GetValue(_src, i) * Power(1 + (Power(i, 2) / ((Power(_h, 2) * 2 * r))), -r);
    _cumulativeWeight = fold j = 0 to  _size + x_0 with q do
        q + Power(1 + (Power(j, 2) / ((Power(_h, 2) * 2 * r))), -r);
    plot currentWeight = _currentWeight;
    plot cumulativeWeight = _cumulativeWeight;
}
# //----Type 1 Calc

def currentWeight1 = kernel(src, size, LookbackWindow, RegressionStartBar, RelativeWeighting).currentWeight;
def cumulativeWeight1 = kernel(src, size, LookbackWindow, RegressionStartBar, RelativeWeighting).cumulativeWeight;
def currentWeight2 = kernel(src, size, LookbackWindow - lag, RegressionStartBar, RelativeWeighting).currentWeight;
def cumulativeWeight2 = kernel(src, size, LookbackWindow - lag, RegressionStartBar, RelativeWeighting).cumulativeWeight;
def yha1 = currentWeight1 / cumulativeWeight1;
def yha2 = currentWeight2 / cumulativeWeight2;

def yhat1 = if Smoothing then WMA(yha1, smoothLength) else yha1;
def yhat2 = if Smoothing then WMA(yha2, smoothLength) else yha2;
#// Rates of Change
def wasBearish = yhat1[2] > yhat1[1];
def wasBullish = yhat1[2] < yhat1[1];
def isBearish  = yhat1[1] > yhat1;
def isBullish  = yhat1[1] < yhat1;
def isBearishChange = isBearish and wasBullish;
def isBullishChange = isBullish and wasBearish;
#// Crossovers
def isBullishCross = Crosses(yhat2, yhat1, CrossingDirection.ABOVE);
def isBearishCross = Crosses(yhat2, yhat1, CrossingDirection.BELOW);
def isBullishSmooth = yhat2 > yhat1;
def isBearishSmooth = yhat2 < yhat1;
# //--- Type 2 Calc
def sum;
def mae;
def sumw;
def sum_e;
def y2;
def Bandwidth = LookbackWindow;
    sum  = fold j = 0 to size-1 with p do
           p +  src[j] *  Exp(-(Power(if lag then counter(size, Bandwidth)-j else
                j,2)/(Bandwidth*Bandwidth*2)));

    sumw = fold k = 0 to size-1 with q do
           q + Exp(-(Power(if lag then counter(size,Bandwidth)-k else k,2)/(Bandwidth*Bandwidth*2)));

    y2 = if smoothing then Average(sum/sumw, smoothLength) else (sum/sumw);

    sum_e = fold i = 0 to size-1 with r do
                r + absValue(src[i] - y2[i]);

    mae = if smoothing then WMA(sum_e/size*Multiplier, smoothLength) else sum_e / size*Multiplier;

# //------Type3 Calc
def Sample = min(SmaplePeriod, 1000);
def SuperHi = super(h, Sample);
def SuperLo = super(l, Sample);
def Dev = (SuperHi - SuperLo) / 2 * Multiplier;
def d = SuperLo + (SuperHi - SuperLo)/2;
def Mid = if smoothing then WMA(d, smoothLength) else d;

#// Colors
def plotColor = if CalcType == 1 then
                if smoothColors then isBullishSmooth else isBullish else
                if CalcType == 2 then if y2 > y2[1] and y2[1] > y2[2] then 1 else 0 else
                if Mid>Mid[1] then 1 else 0;

#// Plot
def KernelEst = if CalcType == 1 then yhat1 else
                if CalcType == 2 then y2 else Mid;# "Rational Quadratic Kernel Estimate"
plot RQKernelEst = KernelEst;
RQKernelEst.AssignValueColor(if plotColor then CreateColor(0, 255, 255) else CreateColor(255, 0, 255));
RQKernelEst.SetLineWeight(2);

def upperBand = if CalcType == 1 then
                RQKernelEst + Multiplier * ATR(AtrPeriod) else
                if CalcType == 2 then y2 + mae else SuperHi + dev;
def lowerBand = if CalcType == 1 then
                RQKernelEst - Multiplier * ATR(AtrPeriod) else
                if CalcType == 2 then y2 - mae else SuperLo - dev;

plot upperje = if ShowBand then upperBand else na;    # "Rational Quadratic Kernel Upper"
plot lowerje = if ShowBand then lowerBand else na;    # "Rational Quadratic Kernel Lower"
upperje.SetDefaultColor(CreateColor(0, 255, 255));
lowerje.SetDefaultColor(CreateColor(255, 0, 255));

#/plot(yhat1 + multi, "Rational Quadratic Kernel Estimate", color=color.silver, linewidth=2)
def SigU = Crosses(c, lowerBand, CrossingDirection.ABOVE);#,char = "?", location = location.abovebar)
def SigD = Crosses(c, upperBand, CrossingDirection.BELOW);#,char = "?",location = location.belowbar)
def SigUCount = if SigU then 1 else SigUCount[1] + 1;
def SigDCount = if SigD then 1 else SigDCount[1] + 1;
def SigUp = SigU and SigUCount[1]> 5;
def SigDn = SigD and SigDCount[1]> 5;
#------ CLOUD---
AddCloud(if ShowCloud then upperBand else na, RQKernelEst, CreateColor(4, 103, 117));
AddCloud(if ShowCloud then RQKernelEst else na, lowerBand, CreateColor(100, 2, 117));

#------ Bubbles
AddChartBubble(ShowBubble and SigUp, l, "B", CreateColor(0, 255, 255), no);
AddChartBubble(ShowBubble and SigDn, h, "S", CreateColor(255, 0, 255), yes);

#### END
Last edited by a moderator:


