Can I have this same setup but painting Heikin Ashi Candles Colors, The other Heikin Ashi Scripts I found have wicks and I only want the box of high and bottom like this one but showing the color of the heikin ashi candle on that time frame.
Added Cloud Coloring Choice at the Input Screen with this snippet basis:
Code:#### Cloud Coloring def cloud_o; def cloud_c; def Heiken_close = (o + h + l + c) / 4; def Heiken_open = CompoundValue(1, (Heiken_open[1] + Heiken_close[1]) / 2, (o[1] + c[1]) / 2); input cloud_color = {default candle, heiken_ashi}; switch (cloud_color) { case candle: cloud_o = o; cloud_c = c; case heiken_ashi: cloud_o = Heiken_open; cloud_c = Heiken_close; }
Here is the full revised code with the snippet and other necessary changes referencing the choice made.
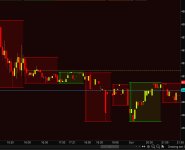
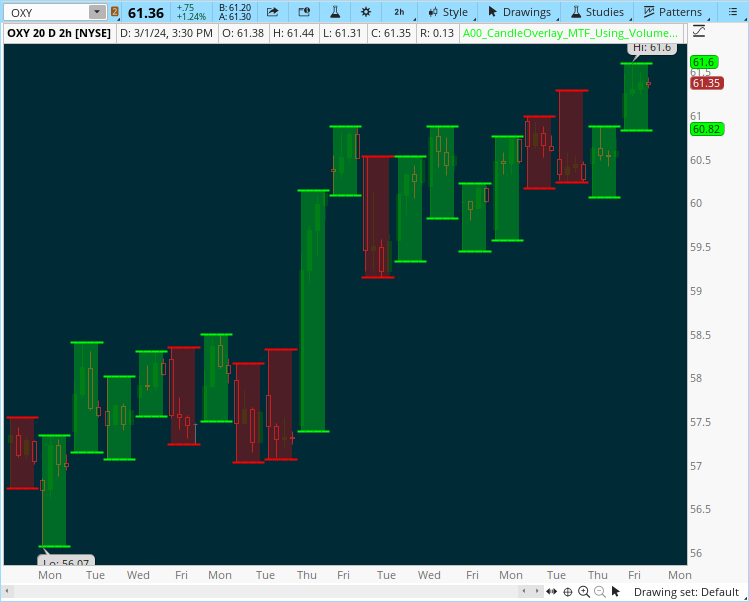
The image shows a 1d1m chart with a 15m chart overlay with Heiken Ashi coloring.
 Code:
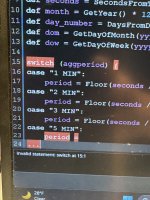
Code:#CandleOverlay_MTF_Using_VolumeProfile #Added Cloud Coloring Choice between Candle/Heiken_Ashi input ShowTodayOnly = { default "No", "Yes"}; input showbubbles = yes; input aggperiod = {"1 MIN", "2 MIN", "3 MIN", "5 MIN", "10 MIN", "15 MIN", "30 MIN", "1 HOUR", default "DAY", "WEEK", "MONTH", "QUARTER", "YEAR"}; input displace = 0; def period; def yyyymmdd = GetYYYYMMDD(); def seconds = SecondsFromTime(0); def month = GetYear() * 12 + GetMonth(); def qtr = (GetMonth() - 1 ) % 3; def day_number = DaysFromDate(First(yyyymmdd)) + GetDayOfWeek(First(yyyymmdd)); def dom = GetDayOfMonth(yyyymmdd); def dow = GetDayOfWeek(yyyymmdd - dom + 1); switch (aggperiod) { case "1 MIN": period = Floor(seconds / 60 + day_number * 24 * 60); case "2 MIN": period = Floor(seconds / 120 + day_number * 24); case "3 MIN": period = Floor(seconds / 180 + day_number * 24); case "5 MIN": period = Floor(seconds / 300 + day_number * 24); case "10 MIN": period = Floor(seconds / 600 + day_number * 24); case "15 MIN": period = Floor(seconds / 900 + day_number * 24); case "30 MIN": period = Floor(seconds / 1800 + day_number * 24); case "1 HOUR": period = Floor(seconds / 3600 + day_number * 24); case "DAY": period = CountTradingDays(Min(First(yyyymmdd), yyyymmdd), yyyymmdd) - 1; case "WEEK": period = Floor(day_number / 7); case "MONTH": period = Floor(month - First(month)); case QUARTER: period = qtr == 0 and qtr[1] != 0; case "YEAR": period = GetYear(); } def bn = BarNumber(); def na = Double.NaN; def o = open(period = aggperiod)[displace]; def c = close(period = aggperiod)[displace]; def h = high(period = aggperiod)[displace]; def l = low(period = aggperiod)[displace]; def r = if period != period[1] then 0 else 1; def b = if period != period[1] then bn else b[1]; def xb = b; #### Cloud Coloring def cloud_o; def cloud_c; def Heiken_close = (o + h + l + c) / 4; def Heiken_open = CompoundValue(1, (Heiken_open[1] + Heiken_close[1]) / 2, (o[1] + c[1]) / 2); input cloud_color = {default candle, heiken_ashi}; switch (cloud_color) { case candle: cloud_o = o; cloud_c = c; case heiken_ashi: cloud_o = Heiken_open; cloud_c = Heiken_close; } plot ORH = if ShowTodayOnly and !IsNaN(close(period = aggperiod)[-1]) then Double.NaN else high(period = aggperiod)[displace]; plot ORL = if ShowTodayOnly and !IsNaN(close(period = aggperiod)[-1]) then Double.NaN else low(period = aggperiod)[displace]; ORH.AssignValueColor(if cloud_c > cloud_o then Color.GREEN else if cloud_c < cloud_o then Color.RED else Color.WHITE); ORH.SetPaintingStrategy(PaintingStrategy.HORIZONTAL); ORH.SetLineWeight(2); ORL.AssignValueColor(if cloud_c > cloud_o then Color.GREEN else if cloud_c < cloud_o then Color.RED else Color.WHITE); ORL.SetPaintingStrategy(PaintingStrategy.HORIZONTAL); ORL.SetLineWeight(2); input showcloud = yes; AddCloud( if showcloud and r and cloud_c > cloud_o then ORH else Double.NaN, if r then ORL else Double.NaN, Color.GREEN, Color.GREEN); AddCloud( if showcloud and r and cloud_c < cloud_o then ORH else Double.NaN, if r then ORL else Double.NaN, Color.RED, Color.RED); AddCloud( if showcloud and r and cloud_c == cloud_o then ORH else Double.NaN, if r then ORL else Double.NaN, Color.WHITE, Color.WHITE); AddCloud( if showcloud and Between(bn, xb - 1, xb + 1) and cloud_c > cloud_o then ORH else Double.NaN, if Between(bn, xb - 1, xb + 1) then ORL else Double.NaN, Color.GREEN, Color.GREEN); AddCloud( if showcloud and Between(bn, xb - 1, xb + 1) and cloud_c < cloud_o then ORH else Double.NaN, if Between(bn, xb - 1, xb + 1) then ORL else Double.NaN, Color.RED, Color.RED); AddCloud( if showcloud and Between(bn, xb - 1, xb + 1) and cloud_c == cloud_o then ORH else Double.NaN, if Between(bn, xb - 1, xb + 1) then ORL else Double.NaN, Color.WHITE, Color.WHITE); #