
Author Message: - Modified -
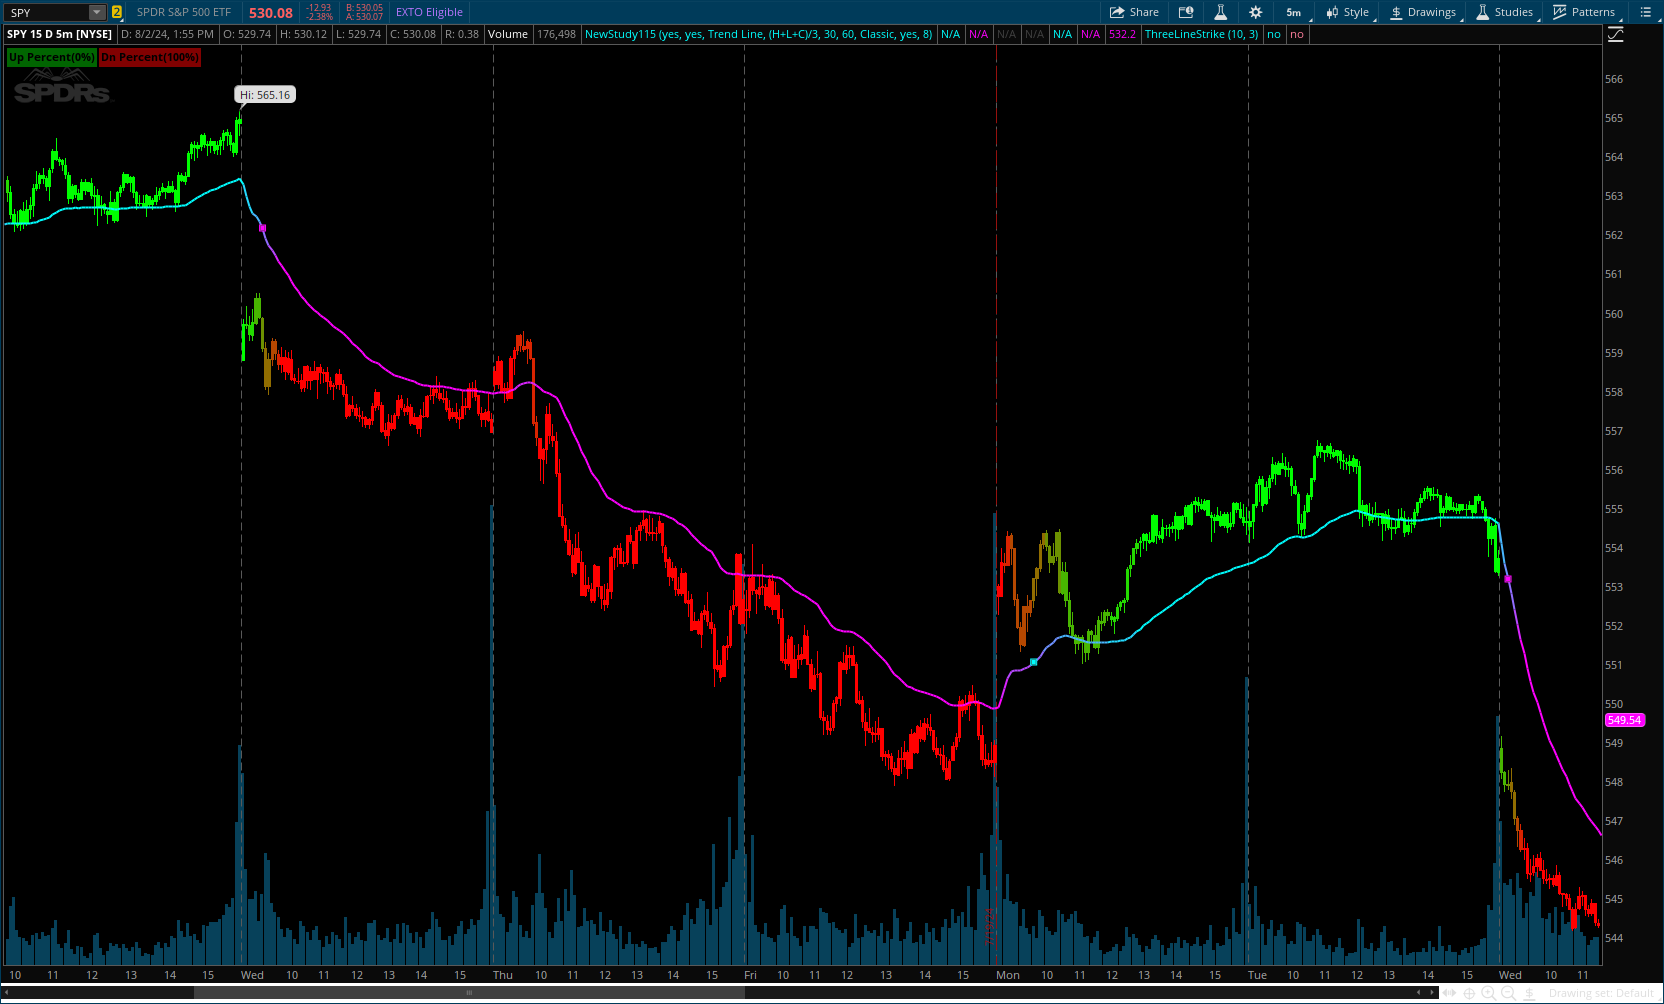
The Multi Deviation Scaled Moving Average is an analysis tool that combines multiple Deviation Scaled Moving Averages (DSMAs) to provide a comprehensive view of market trends. The DSMA, originally created by John Ehlers, is a sophisticated moving average that adapts to market volatility. This indicator offers a unique approach to trend analysis by utilizing a series of DSMAs with different periods and presenting the results through a color-coded line and a visual histogram.
CODE:
CSS:
#// Indicator for TOS
#// © ChartPrime
#indicator("Multi Deviation Scaled Moving Average [ChartPrime]", "Multi DSMA - [ChartPrime]", overlay=true)
#Hint Sensitivity: The Lower input Lower sensitivity.
#Hint noOfMovAvg: Max = 12 MovAvg, Min = 2 MovAvg.
# Converted and mod by Sam4Cok@Samer800    - 08/2024
input showLabel = yes;
input colorBars = yes;
input displayOptions = {default "Trend Line", "Trend Cloud", "Trend Line & Cloud"};
input src    = hlc3;
input period = 30; #, title="Period")
input Sensitivity   = 60; #, "Sensitivity", minval = 0, maxval = 100
input cloudTheme  =  {default Select, Classic, Mono, Modren};
input showCloudGrid = no;
input noOfMovAvg = 8;

def na = Double.NaN;
def last = IsNaN(close);
def both = displayOptions == displayOptions."Trend Line & Cloud";
def ribbon = displayOptions == displayOptions."Trend Cloud" or both;
def avgLine = displayOptions == displayOptions."Trend Line" or both;
def step = 100 - Min(Max(Sensitivity, 0), 100);
def n = Min(Max(noOfMovAvg, 2), 12);

#-- Color
def rUp;
def gUp;
def bUp;
def rDn;
def gDn;
def bDn;
switch (cloudTheme) {
case Classic  :
    rUp = 1;
    gUp = 101;
    bUp = 1;
    rDn = 129;
    gDn = 1;
    bDn = 1;
case Modren :
    rUp = 4;
    gUp = 156;
    bUp = 179;
    rDn = 123;
    gDn = 3;
    bDn = 143;
case Mono  :
    rUp = 178;
    gUp = 181;
    bUp = 190;
    rDn = 64;
    gDn = 64;
    bDn = 64;
default :
    rUp = 0;
    gUp = 101;
    bUp = 0;
    rDn = 129;
    gDn = 0;
    bDn = 0;
}
DefineGlobalColor("up", CreateColor(rUp, gUp, bUp));
DefineGlobalColor("dn", CreateColor(rDn, gDn, bDn));
#DefineGlobalColor("up", CreateColor(178, 181, 190));
#DefineGlobalColor("dn", CreateColor(64, 64, 64));
#// @function Calculates the Deviation Scaled Moving Average (DSMA)
#// @param src (series float) Source price series
#// @param period (int) Calculation period
#// @returns (float) DSMA value
script dsma {
    input src = hlc3;
    input period = 30;
    def wma = WildersAverage(src, Floor(period / 2));
    def pi = Double.Pi;
    def g  = Sqrt(2);
    def s  = 2 * pi / period;
    def a1 = Exp(-g * pi / (0.5 * period));
    def b1 = 2 * a1 * Cos(g * s / (0.5 * period));
    def c2 = b1;
    def c3 = -a1 * a1;
    def c1 = 1 - c2 - c3;
    def zeros = (close - close[2]);
    def avg = (zeros + zeros[1]) / 2;
    def filt = CompoundValue(1, c1 * avg + c2 * filt[1] + c3 * filt[2], 0);
    def sqrVal = Sqr(filt);
    def ema = ExpAverage(sqrVal, period);
    def rms = Sqrt(ema);
    def scaled_filt = if rms != 0 then filt / rms else 0;
    def alpha1 = AbsValue(scaled_filt) * 5 / period;
    def dsma = CompoundValue(1, alpha1 * close + (1 - alpha1) * dsma[1], wma);
    plot out = dsma;
}
# // Calculate DSMAs with increasing periods
def  val = 1 / (n - 1);
def length1  = period;
def length2  = length1 + step;
def length3  = length2 + step;
def length4  = length3 + step;
def length5  = length4 + step;
def length6  = length5 + step;
def length7  = length6 + step;
def length8  = length7 + step;
def length9  = length8 + step;
def length10  = length9 + step;
def length11  = length10 + step;
def length12  = length11 + step;
def dsma1   = dsma(src, length1);
def dsma2   = dsma(src, length2);
def dsma3   = if n < 3 then 0 else dsma(src, length3);
def dsma4   = if n < 4 then 0 else dsma(src, length4);
def dsma5   = if n < 5 then 0 else dsma(src, length5);
def dsma6   = if n < 6 then 0 else dsma(src, length6);
def dsma7   = if n < 7 then 0 else dsma(src, length7);
def dsma8   = if n < 8 then 0 else dsma(src, length8);
def dsma9   = if n < 9 then 0 else dsma(src, length9);
def dsma10   = if n < 10 then 0 else dsma(src, length10);
def dsma11   = if n < 11 then 0 else dsma(src, length11);
def dsma12   = if n < 12 then 0 else dsma(src, length12);
def longDsma = if n > 11 then dsma12 else if n > 10 then dsma11 else if n > 9  then dsma10 else
               if n > 8  then dsma9  else if n > 7 then  dsma8  else if n > 6  then dsma7  else
               if n > 5  then dsma6  else if n > 4 then  dsma5  else if n > 3  then dsma4  else
               if n > 2  then dsma3  else dsma2;
def score1  = if dsma1 > longDsma then val else 0;
def score2  = if n < 3  then 0 else if dsma2 >  longDsma then val else 0;
def score3  = if n < 4  then 0 else if dsma3 >  longDsma then val else 0;
def score4  = if n < 5  then 0 else if dsma4 >  longDsma then val else 0;
def score5  = if n < 6  then 0 else if dsma5 >  longDsma then val else 0;
def score6  = if n < 7  then 0 else if dsma6 >  longDsma then val else 0;
def score7  = if n < 8  then 0 else if dsma7 >  longDsma then val else 0;
def score8  = if n < 9  then 0 else if dsma8 >  longDsma then val else 0;
def score9  = if n < 10 then 0 else if dsma9 >  longDsma then val else 0;
def score10 = if n < 11 then 0 else if dsma10 > longDsma then val else 0;
def score11 = if n < 12 then 0 else if dsma11 > longDsma then val else 0;

def Avgdsma1 = (dsma1 + dsma2 + dsma3 + dsma4 + dsma5 + dsma6 + dsma7 +
                dsma8 + dsma9 + dsma10 + dsma11 + dsma12) / n;
def Avgdsma  = Average(Avgdsma1, 1);
def scoreTot = score1 + score2 + score3 + score4 + score5 + score6 +
               score7 + score8 + score9 + score10 + score11;
def score    = if IsNaN(scoreTot) then 0 else
               if scoreTot > 1 then 1 else if scoreTot < 0 then 0 else scoreTot;
def col = score * 255;
#// Detect crossovers for signal generation
def cross_up = (score crosses above 0.3);
def cross_dn = (score crosses below 0.7);

#-- Plots
plot up = if cross_up then Avgdsma else na;
plot dn = if cross_dn then Avgdsma else na;
plot up1 = if cross_up then Avgdsma else na;
plot dn1 = if cross_dn then Avgdsma else na;
plot up2 = if cross_up then Avgdsma else na;
plot dn2 = if cross_dn then Avgdsma else na;
plot dsmaLine = if avgLine and Avgdsma then Avgdsma else na;
dsmaLine.AssignValueColor(CreateColor(255 - col, col, 255));
dsmaLine.SetLineWeight(2);
up.SetDefaultColor(Color.CYAN);
dn.SetDefaultColor(Color.MAGENTA);
up.SetPaintingStrategy(PaintingStrategy.SQUARES);
dn.SetPaintingStrategy(PaintingStrategy.SQUARES);
up1.SetDefaultColor(Color.DARK_GRAY);
dn1.SetDefaultColor(Color.DARK_GRAY);
up1.SetPaintingStrategy(PaintingStrategy.SQUARES);
dn1.SetPaintingStrategy(PaintingStrategy.SQUARES);
up1.SetLineWeight(2);
dn1.SetLineWeight(2);
up2.SetDefaultColor(Color.CYAN);
dn2.SetDefaultColor(Color.MAGENTA);
up2.SetPaintingStrategy(PaintingStrategy.SQUARES);
dn2.SetPaintingStrategy(PaintingStrategy.SQUARES);
up2.SetLineWeight(4);
dn2.SetLineWeight(4);

#-- LAbel
def up_percent = Round(score * 100, 0);
def dn_percent = 100 - up_percent;

AddLabel(showLabel, "Up Percent(" + up_percent + "%)", GlobalColor("up"));
AddLabel(showLabel, "Dn Percent(" + dn_percent + "%)", GlobalColor("dn"));

#-- Bar Color

AssignPriceColor(if !colorBars then Color.CURRENT else CreateColor(255 - col, col, 0));

#-- Cloud
def "12" = if ribbon and dsma12 then dsma12 else na;
def "11" = if ribbon and dsma11 then dsma11 else na;
def "10" = if ribbon and dsma10 then dsma10 else na;
def "9" = if ribbon and dsma9 then dsma9 else na;
def "8" = if ribbon and dsma8 then dsma8 else na;
def "7" = if ribbon and dsma7 then dsma7 else na;
def "6" = if ribbon and dsma6 then dsma6 else na;
def "5" = if ribbon and dsma5 then dsma5 else na;
def "4" = if ribbon and dsma4 then dsma4 else na;
def "3" = if ribbon and dsma3 then dsma3 else na;
def "2" = if ribbon and dsma2 then dsma2 else na;
def "1" = if ribbon and dsma1 then dsma1 else na;

#### Signals
def start = ohlc4;
AddCloud("12", "11", GlobalColor("dn"), GlobalColor("up"), showCloudGrid);
AddCloud("11", "10", GlobalColor("dn"), GlobalColor("up"), showCloudGrid);
AddCloud("10", "9",  GlobalColor("dn"), GlobalColor("up"), showCloudGrid);
AddCloud("9",  "8",  GlobalColor("dn"), GlobalColor("up"), showCloudGrid);
AddCloud("8",  "7",  GlobalColor("dn"), GlobalColor("up"), showCloudGrid);
AddCloud("7",  "6",  GlobalColor("dn"), GlobalColor("up"), showCloudGrid);
AddCloud("6",  "5",  GlobalColor("dn"), GlobalColor("up"), showCloudGrid);
AddCloud("5",  "4",  GlobalColor("dn"), GlobalColor("up"), showCloudGrid);
AddCloud("4",  "3",  GlobalColor("dn"), GlobalColor("up"), showCloudGrid);
AddCloud("3",  "2",  GlobalColor("dn"), GlobalColor("up"), showCloudGrid);
AddCloud("2",  "1",  GlobalColor("dn"), GlobalColor("up"), showCloudGrid);
AddCloud("1",  start,GlobalColor("dn"), GlobalColor("up"), showCloudGrid);

#-- end of code