MTF Stochastic Full Cross?

LLP

Member
VIP
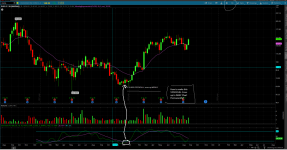
How to make STOCKFULL cross up in WEEKLY appear in DAILY chart permanently? Without me typing one by one each time?
With changeable color and symbols on DAILY chart.
 

Attachments

  • Screenshot 2023-09-01 213858.png
    Screenshot 2023-09-01 213858.png
    334.5 KB · Views: 185
Solution
How to make STOCKFULL cross up in WEEKLY appear in DAILY chart permanently? Without me typing one by one each time?
With changeable color and symbols on DAILY chart.

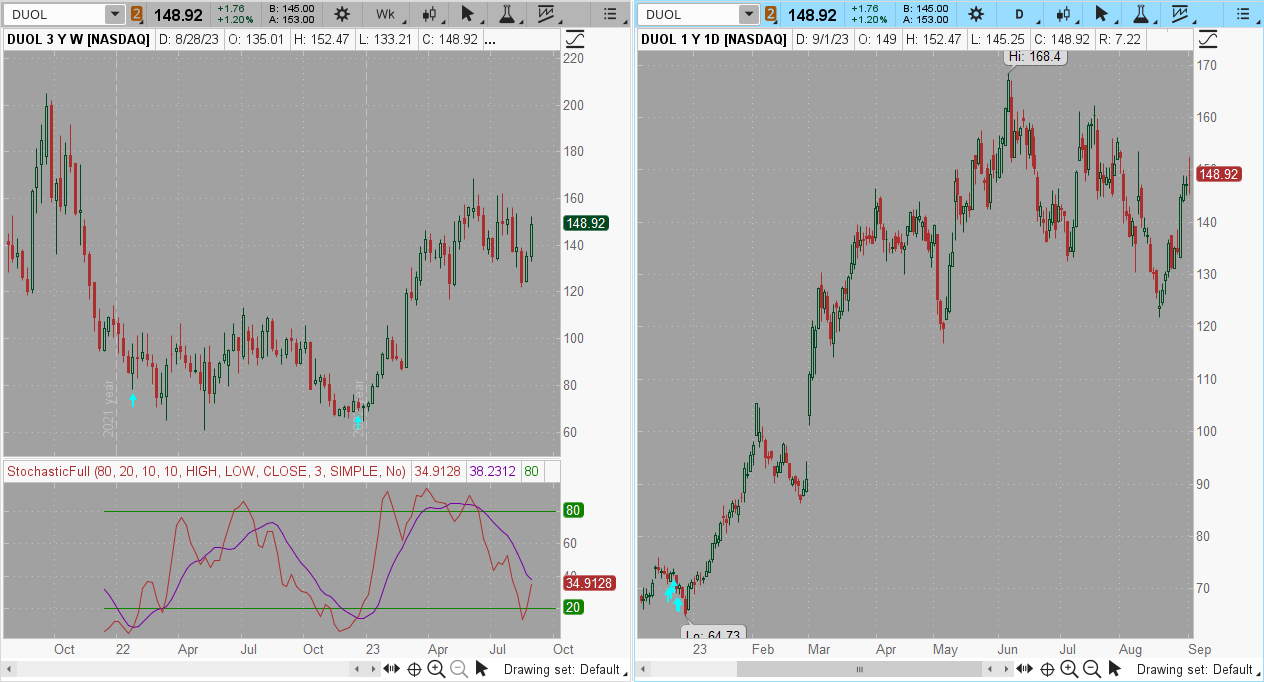
Here ya go. Keep in mind that it take 5 daily bars to equal 1 week bar which means the arrows will repaint on each of the 5 daily bars until the weekly bar is finished forming.

shared grid link: http://tos.mx/XAKLZtl
Mb5g2ik.png

Ruby:
# MTF StochasticFull Cross
# @LLP 9/2023

input over_bought = 80;
input over_sold = 20;
input KPeriod = 10;
input DPeriod = 10;
input agg = AggregationPeriod.WEEK;
def priceH = high(period = agg);;
def priceL = low(period = agg);;
def priceC = close(period = agg);;
input slowing_period = 3;
input...
How to make STOCKFULL cross up in WEEKLY appear in DAILY chart permanently? Without me typing one by one each time?
With changeable color and symbols on DAILY chart.

Here ya go. Keep in mind that it take 5 daily bars to equal 1 week bar which means the arrows will repaint on each of the 5 daily bars until the weekly bar is finished forming.

shared grid link: http://tos.mx/XAKLZtl
Mb5g2ik.png

Ruby:
# MTF StochasticFull Cross
# @LLP 9/2023

input over_bought = 80;
input over_sold = 20;
input KPeriod = 10;
input DPeriod = 10;
input agg = AggregationPeriod.WEEK;
def priceH = high(period = agg);;
def priceL = low(period = agg);;
def priceC = close(period = agg);;
input slowing_period = 3;
input averageType = AverageType.SIMPLE;
input showBreakoutSignals = {default "No", "On FullK", "On FullD", "On FullK & FullD"};

def lowest_k = Lowest(priceL, KPeriod);
def c1 = priceC - lowest_k;
def c2 = Highest(priceH, KPeriod) - lowest_k;
def FastK = if c2 != 0 then c1 / c2 * 100 else 0;

def FullK = MovingAverage(averageType, FastK, slowing_period);
def FullD = MovingAverage(averageType, FullK, DPeriod);

def OverBought = over_bought;
def OverSold = over_sold;

plot crossup = FullK<= OverSold and FullD<= OverSold and FullK crosses above FullD ;
crossup.SetPaintingStrategy(PaintingStrategy.BOOLEAN_ARROW_UP);
crossup.SetDefaultColor(color.cyan) ;
 
Last edited:
Solution

Join useThinkScript to post your question to a community of 21,000+ developers and traders.

Here ya go. Keep in mind that it take 5 daily bars to equal 1 week bar which means the arrows will repaint on each of the 5 daily bars until the weekly bar is finished forming.

shared grid link: http://tos.mx/XAKLZtl
Mb5g2ik.png

Ruby:
# MTF StochasticFull Cross
# @LLP 9/2023

input over_bought = 80;
input over_sold = 20;
input KPeriod = 10;
input DPeriod = 10;
input agg = AggregationPeriod.WEEK;
def priceH = high(period = agg);;
def priceL = low(period = agg);;
def priceC = close(period = agg);;
input slowing_period = 3;
input averageType = AverageType.SIMPLE;
input showBreakoutSignals = {default "No", "On FullK", "On FullD", "On FullK & FullD"};

def lowest_k = Lowest(priceL, KPeriod);
def c1 = priceC - lowest_k;
def c2 = Highest(priceH, KPeriod) - lowest_k;
def FastK = if c2 != 0 then c1 / c2 * 100 else 0;

def FullK = MovingAverage(averageType, FastK, slowing_period);
def FullD = MovingAverage(averageType, FullK, DPeriod);

def OverBought = over_bought;
def OverSold = over_sold;

plot crossup = FullK<= OverSold and FullD<= OverSold and FullK crosses above FullD ;
crossup.SetPaintingStrategy(PaintingStrategy.BOOLEAN_ARROW_UP);
crossup.SetDefaultColor(color.cyan) ;
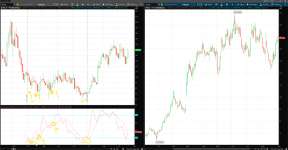
Thank you. Suppose all cross-up showing signal like I circle in yellow. why only 2 parts?
 

Attachments

  • Screenshot 2023-09-03 075719.STOCKCROSS.UP.png
    Screenshot 2023-09-03 075719.STOCKCROSS.UP.png
    284.3 KB · Views: 124
Thank you. Suppose all cross-up showing signal like I circle in yellow. why only 2 parts?
You did not circle any of those other crosses in your original image.
Here is the code for ALL crosses regardless of where they occur.
Change this line of code:
plot crossup = FullK<= OverSold and FullD<= OverSold and FullK crosses above FullD ;
To:
plot crossup = FullK crosses above FullD ;

Originally, you only circled the cross that occurred below the oversold line.
And that "general" idea was correct.

A limiter on WHERE on the oscillator scale the cross occurs should be a consideration when used on your middle and upper timeframes.
~~Crosses that occur around the midpoint have more potential for profit growth.
~~Crosses that occur high up on the oscillator scale represent less chance of a significant profitable trend.

I agree the static oversold line is not optimal as it misses many trends when the oscillator is not in that range.

Here is an idea to consider:
Where your newest idea finds all crosses and your original idea looked for crosses that occurred below OS==20, here is a code that is a compromise.
It includes all crosses that occur below 60 on the oscillator scale.
input Limiter = 60 ;
plot crossup = FullK<= Limiter and FullK crosses above FullD ;

1, Based on what instrument that you trade; revise where is best to set your limiter.

2. Keep in mind this only sets an upper Limiter. You can also consider setting a lower limiter which filters out crosses that occur very low on the oscillator scale.
This will assist in eliminating the double bottoms and whipsaw action.
Example of a high & low limiter, looks for FullK to be above or equal to FullD and to be around the midpoint of the oscillator scale
input uLimiter = 60;
input lLimiter = 40;
plot crossup = FullK<= uLimiter and FullK>=lLimiter and FullK >= FullD ;
This DOES NOT signal at the very beginning of a trend or at the low because that is where the double bottoms and whip saw action will most likely occur. Rather this signals when the trend is reaching confirmation. AGAIN, can't be emphasized enough that the limiters MUST be set for the instrument that you are trading; adjust them higher or lower based on your risk aversion.

If you are a mean reversion or a longer swing trader, do not use a lower limiter.
Reverters and swingers accept sitting through the bumping action at the bottom as the cost of getting in on the very beginning of a "potential" trend.
 
Last edited:
  • Excellent
Reactions: LLP

Similar threads

Not the exact question you're looking for?

Start a new thread and receive assistance from our community.

87k+ Posts
380 Online
Create Post

Similar threads

Similar threads

The Market Trading Game Changer

Join 2,500+ subscribers inside the useThinkScript VIP Membership Club
  • Exclusive indicators
  • Proven strategies & setups
  • Private Discord community
  • ‘Buy The Dip’ signal alerts
  • Exclusive members-only content
  • Add-ons and resources
  • 1 full year of unlimited support

Frequently Asked Questions

What is useThinkScript?

useThinkScript is the #1 community of stock market investors using indicators and other tools to power their trading strategies. Traders of all skill levels use our forums to learn about scripting and indicators, help each other, and discover new ways to gain an edge in the markets.

How do I get started?

We get it. Our forum can be intimidating, if not overwhelming. With thousands of topics, tens of thousands of posts, our community has created an incredibly deep knowledge base for stock traders. No one can ever exhaust every resource provided on our site.

If you are new, or just looking for guidance, here are some helpful links to get you started.

What are the benefits of VIP Membership?
VIP members get exclusive access to these proven and tested premium indicators: Buy the Dip, Advanced Market Moves 2.0, Take Profit, and Volatility Trading Range. In addition, VIP members get access to over 50 VIP-only custom indicators, add-ons, and strategies, private VIP-only forums, private Discord channel to discuss trades and strategies in real-time, customer support, trade alerts, and much more. Learn all about VIP membership here.
How can I access the premium indicators?
To access the premium indicators, which are plug and play ready, sign up for VIP membership here.
Back
Top